RTS Sentinel
Software User Manual
Verson 1.0.0
RTS Sentinel
Software User Manual
Introduction
RTS Sentinel alerts users to potential issues in the environment based on the user-defined policies and configurations. Alarms expedite the process of identifying, troubleshooting, and responding to issues that may have an impact on mission-critical services and business operations.
The user-defined alarm templates are based on best practises and incorporate a large information base. When a problem happens, you will not only receive an alert, but you will also have all of the information you need to troubleshoot and determine the underlying cause of the problem.
This manual will walk you through the features and functionality of the RTS Sentinel application.
Access and Credentials
Users can access the application through web browser over the Internet.
User Permissions
The user must be registered with OKTA and should have the authorization to access the application via OWAI.
Application Features
List of all the configured alarms
This feature displays a list of all the alarms that the user has configured. This page allows the user to execute alarm-related tasks such as start/stop, edit, or delete a configured alarm.
Configure/create new alarms
User can configure/create an alarm by setting suitable threshold. This screen will guide the user through the process of configuring alarms using alarm templates. They can also create an alarm and configure it to their preference. The user will be able to set up two alarm types.
Triggered alarms screen
The Triggered alarms screen displays all the triggered alarms associated with the alarm policies and alarm rules that have been established. The alarms can be viewed by users based on the wells to which they have access. This will have three separate alarm views: unaddressed, addressed, and historical.
Filter triggered alarms screen
By default, the triggered alarms screen displays all unaddressed alarms. Alarms can be filtered using criteria based on one or more alarms parameters, such as severity, status, wellbore and so on.
Refresh triggered alarms screen
User can refresh the triggered alarms screen to view the latest details of the triggered alarms.
Details view of the triggered alarms
This view helps the user to view the triggered alarm in depth.
History Tab (Audit logs) of the triggered alarms
The History tab section in the alarms displays the chronological set of actions performed on the triggered alarms, that helps the user to trace specific event , operation or procedure.
Comments on triggered alarms
The comments section in the alarms helps the user to comment on an alarm.
Perform actions on the triggered alarms
The user will be able to take appropriate action on an alarm using this feature. The actions will be like acknowledging an alarm, clearing an alarm, shelving an alarm etc.
Arranging and sorting the triggered alarms
This feature allows the user to arrange the alarms according to his/her choice and has an option to sort the arrangement accordingly.
Notify newly triggered alarms as a toast message
This feature alerts the user with the newly triggered alarms in the form of a toast message in the top right corner of the screen.
List all the configured alarm templates
This feature will list out all the alarm templates configured in the form of a grid.
Alarm Templates
Alarm templates can be used to create new alarms. By selecting a template, you can quickly configure an alarm.
Application Overview
Login Page
RTS APP STORE has a common login page. The system is accessible to all registered internal and external users. The data, however, is shown dependent on the logged-in user's entitlements.
Please follow the below steps to login to the application
- For UK Wells Login using the URL :https://rtsapp.uks.halliburton.com
- For US Wells login using the URL :https://rtsapp.usc.halliburton.com/

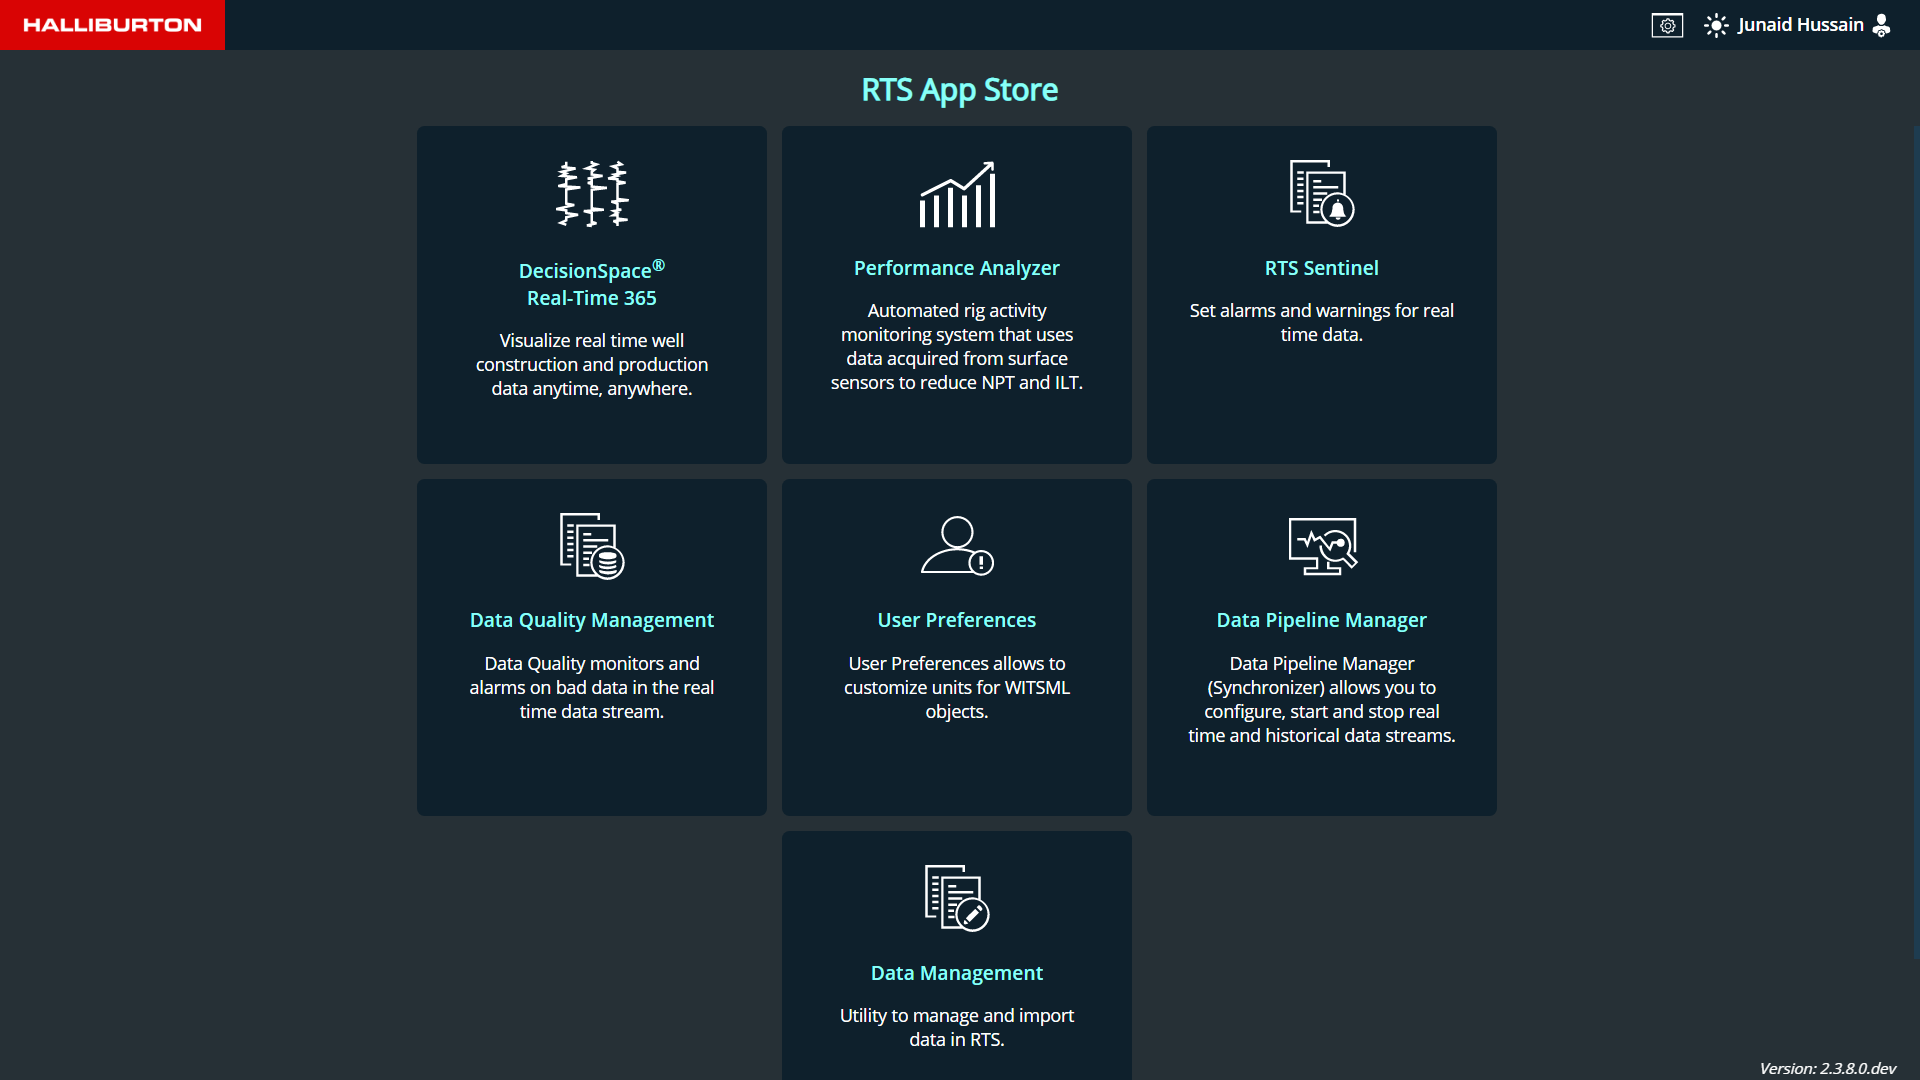
RTS App Store Page
After logging into the application, the user will be sent to the RTS APP Store page, where he will be able to view just the applications to which he is entitled. Click on the RTS Sentinel card to launch the RTS Sentinel App.
Dashboard Page
The landing page of RTS Sentinel app is the Dashboard page. The Dashboard page is broadly divided into two sections
- Active wells
- Favorite wells
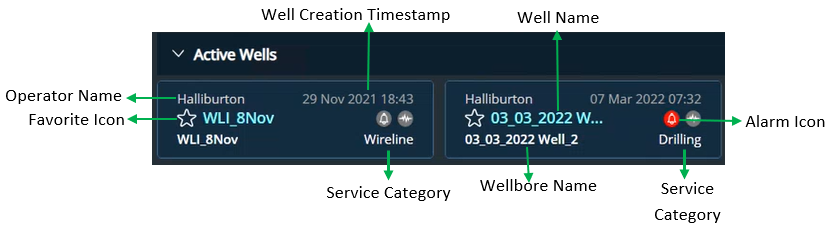
- Operator Name: The name of the operator
- Well Creation Timestamp: The rig time zone will be displayed
- Well Name: Name of the well.
- Wellbore name: Name of the wellbore.
- A star icon to set the well as a favorite well.
- Display the name of the service category.
- An alarm icon is displayed, which helps navigate to the alarms notification page which displays the filtered result.
- An icon, that helps to navigate to Data Quality page which displays the filtered result.
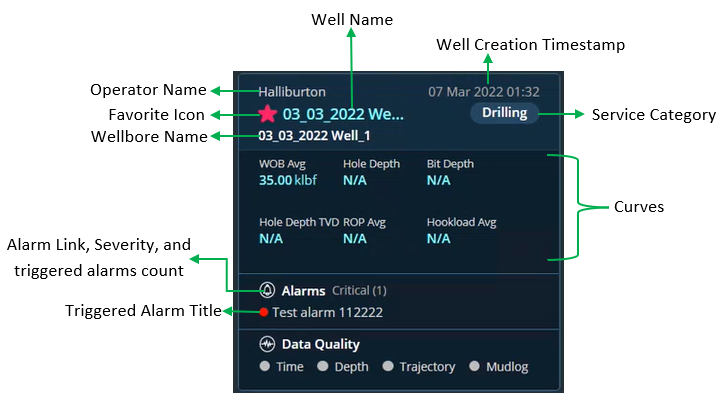
- Operator Name: The name of the operator
- Well Creation Timestamp: The rig time zone will be displayed
- Well Name: Name of the well.
- Wellbore name: Name of the wellbore.
- A star icon to unfavorite a well.
- Display the name of the service category.
- Based on the service category the curve details will be displayed
- An alarm link is displayed, which helps navigate to the alarms page.
- A link is displayed, that helps navigate to the Data Quality page.
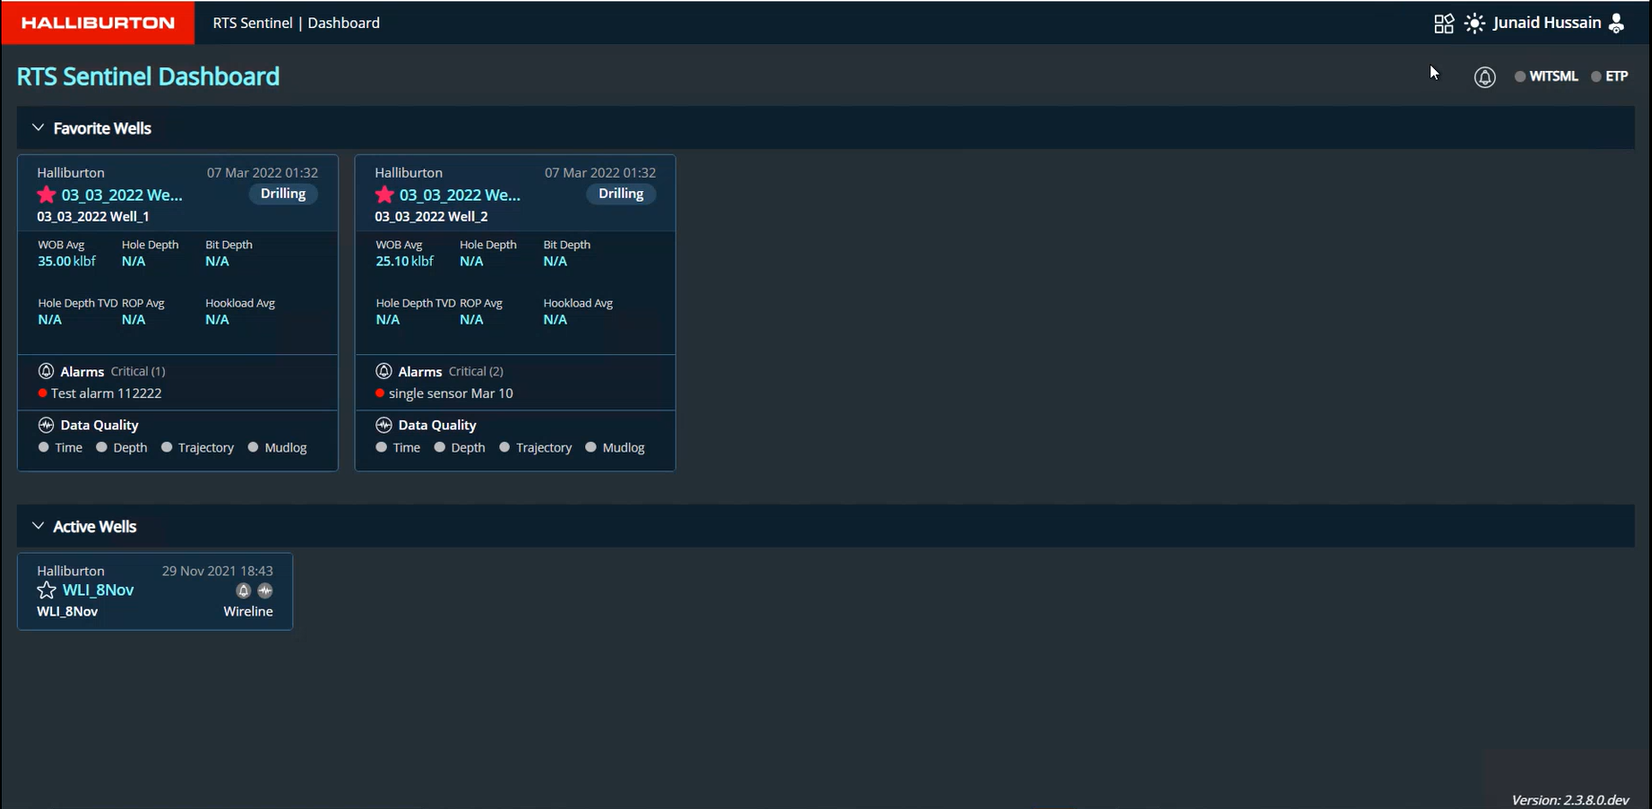
Active Wells
The active wells section displays a card for each of the active wells that the user is entitled to. This card will display the minimal details of the well.
Favorite Wells
Any well can be marked as a favorite well by clicking on the star icon available on each card in the active well section. Onclick of the star icon the well will be moved to the section of the Favorite wells and displays the curves associated with the service category of the well.
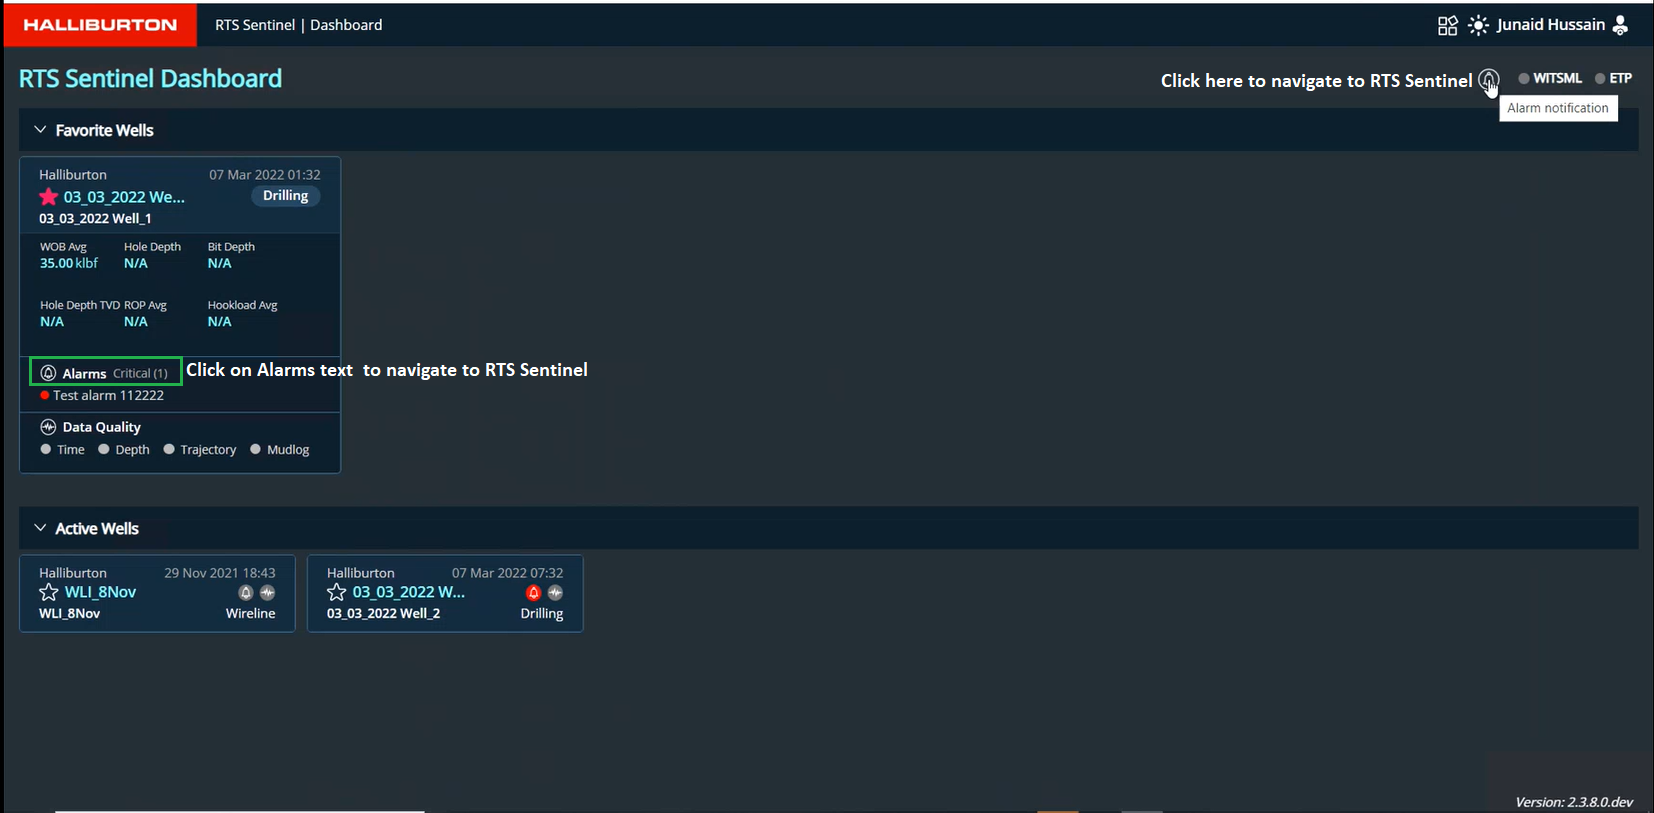
When a user navigates from the dashboard to the RTS Sentinel application, they are sent to the
Triggered alarms page (Alarm notification).
The user is led to the Triggered Alarms page upon clicking the Alarms link in the card,
which displays the filtered list (Alarms triggered in the card) in the unaddressed view.
Click on the filter icon and clear the filter to see the remaining triggered alarms.
Service Categories and their respective defult Curves
| Service Category | Curves | Data Quality logs |
|---|---|---|
| Drilling | Hole Depth Bit Depth Hole Depth TVD ROP Avg Hookload Avg WOB Avg |
Time Depth Trajectory Mudlog |
| Well Testing | Wellhead Pressure Wellhead Temp Casing Press Choke Size Oil Rate Gas Rate Water Rate |
Time, Depth |
| Cementing | Pump Press Slurry Rate Slurry Density Slurry Temp Slurry Volume |
Time |
| Coil Tubing | CT Depth CT Pipe Speed CT Flow Rate CT Pressure CT Pipe Weight |
Time |
| Well Fracturing | Treating Press Backside Press Slurry Rate BH Prop conc WH Prop Conc Calc BH Press |
Time |
| Wireline | Service Name Hole Depth Tool Depth Surface Tension DH Tension Tool Run Speed |
Time, Depth |
| Wellbore Fluids | Hole Depth Bit Depth Hole Depth TVD ROP Avg DFG ECD @ Bit DFG ECD @ CSG Avg Rig Activity |
Time, Depth |
To toggle between Dashboard and RTS App Store please click on the following icon
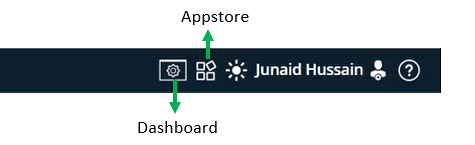
Menu
This application has 3 menu items. The menu bar can be collapsed or expanded by clicking on the arrow button at the bottom as shown in the Figure below
Theme
The application theme can be toggled between day and night theme based on the user's preference by clicking on the theme icon in the top bar.
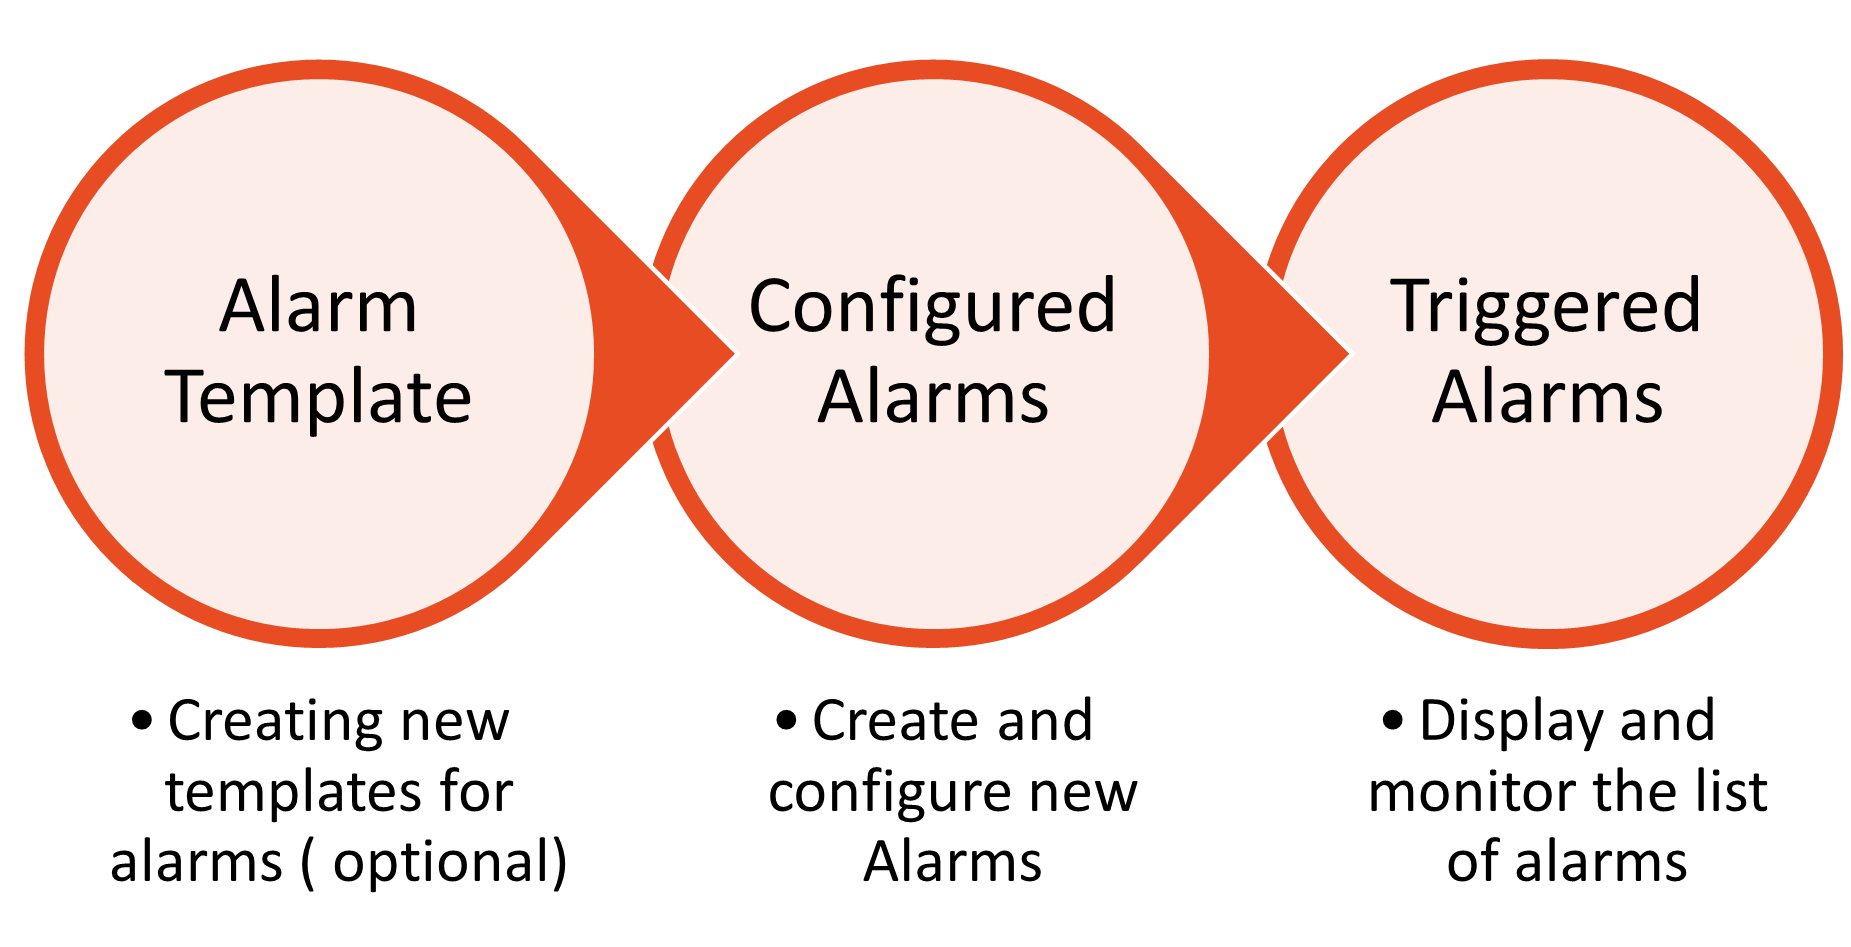
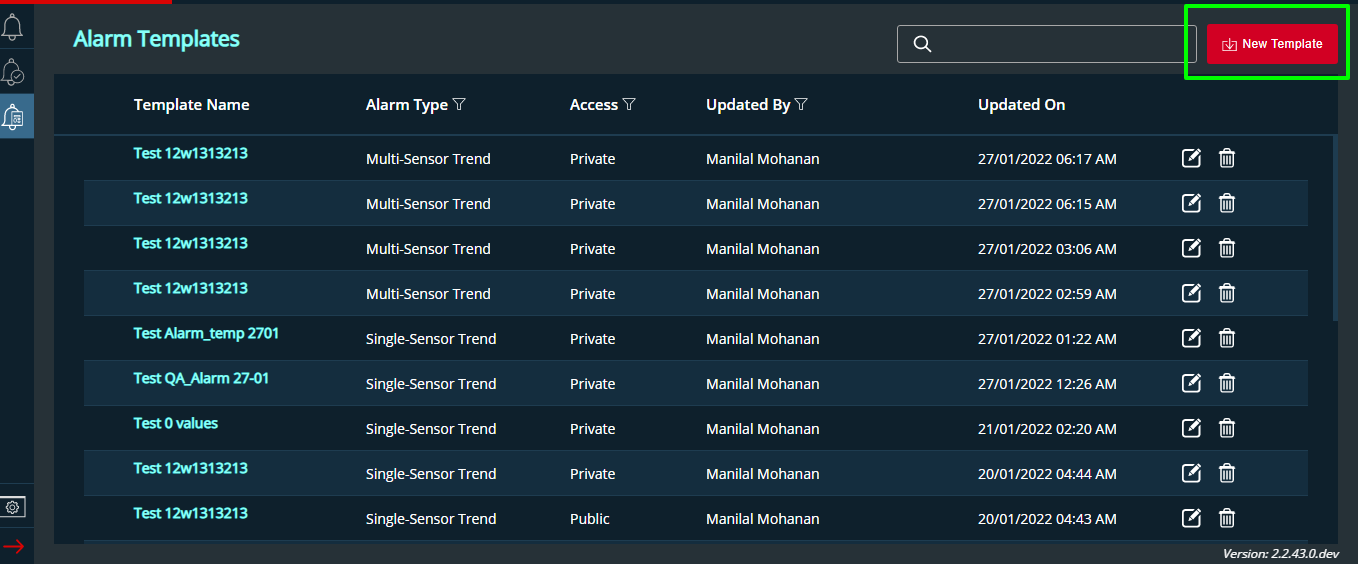
Alarm Template
Custom alarm templates can be created here which will aid the users in configuring or customizing alarms
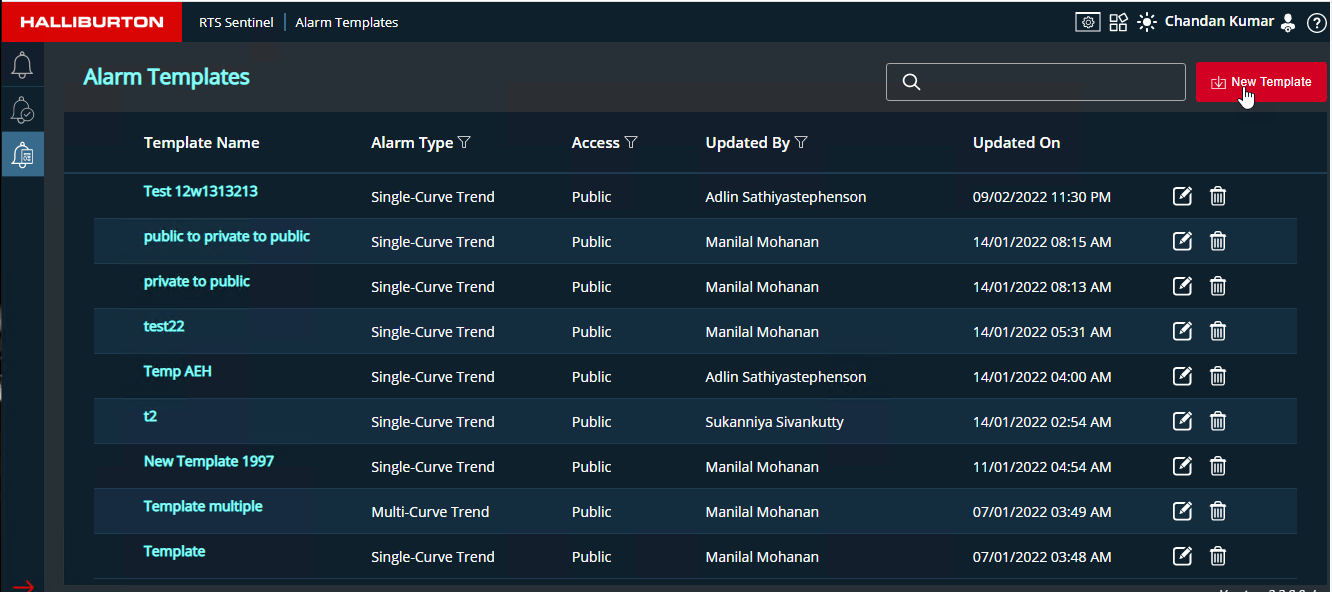
- Template listing will be displayed when this screen loads
- Search functionality is available here to search and filter the templates
- Click on the New Template button to create a new alarm template
- List headers:
- Template Name
- Alarm Type
- Two types of Alarms can be created: Multi-Curve Trend and Single-Curve Trend
- Access
- Private: Visible to the owner who created the template
- Public: Visible to all users
- Updated By
- The name of the user who most recently updated the alarm will be displayed.
- Updated On
- The most recent update date will be shown.
- Edit button: Template can be edited by clicking on the edit button
- Delete button: Template can be deleted by clicking on the delete button
- Use the filter buttons next to the headers of Alarm type, Access and Updated By to narrow down the list of displayed alarm templates
- Alarm Type Filter
- Access
- Updated By
This is a free text search. It works only with the exact match and it is case sensitive
New Template
To create a new template, click on the New Template button
- Template screen comprises of fields: (Please refer to the Figure below)
- Template Name: User can enter the template name here
- Alarm Type
- User can choose from 2 types of alarms
- Single-Curve trend
- Multi-Curve trend
- User can choose from 2 types of alarms
- Version
- Curve Settings
- Activity
- Number of samples for Trend calculation
- Probable Causes
- Recommended Solution
- 3 buttons are available here Publish, Save and Close
-
Single-Curve Trend screen
-
Multi-Curve Trend screen
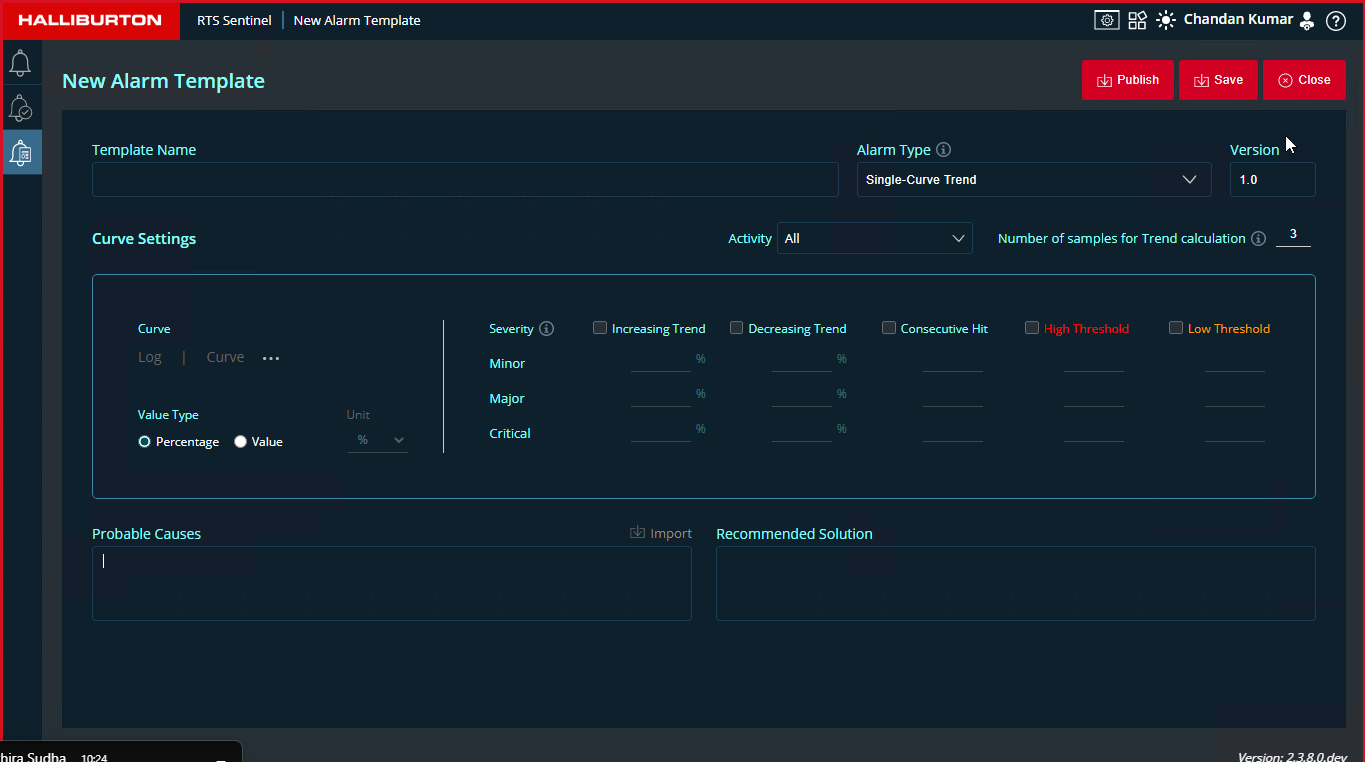
Single-Curve Trend
To create a single-curve trend alarm template, follow the steps below. Only One curve can be configured for this alarm type.
- Enter template name
- Select single-curve trend alarm type from the drop down.
- Enter the version number. By default the version will be 1.0
- User can select activities from the Activity list to configure the alarms. By default, all
activities will be selected
- List of activities are shown in the Figure below
- Alarm will be triggered for all the activities mentioned here
- Number of samples for Trend Calculation
- This field indicates the minimum number of samples that will be used for calculation for triggering of alarms.
- To calculate the trend minimum number of samples is required. Default value is 3.Maximum value is 99
- Samples will be drawn from the log based on the number of values entered.
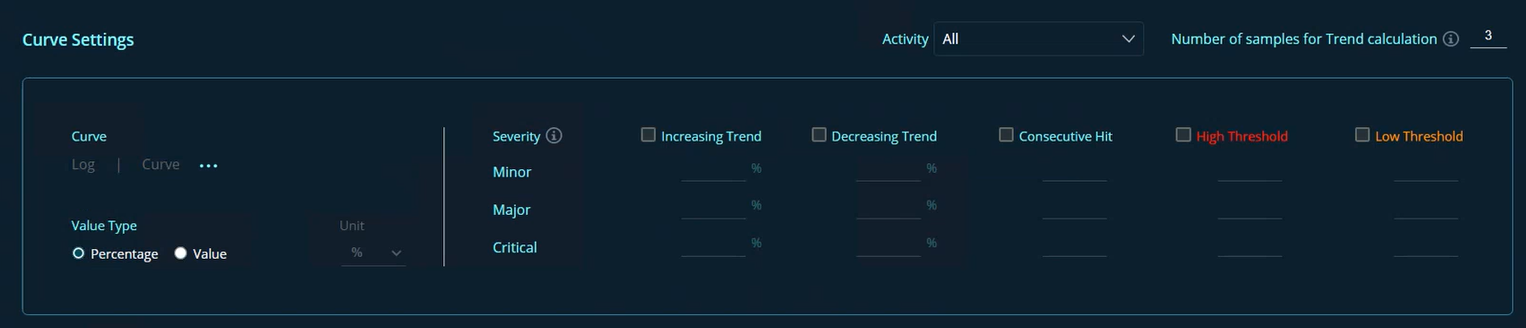
- Curve Settings
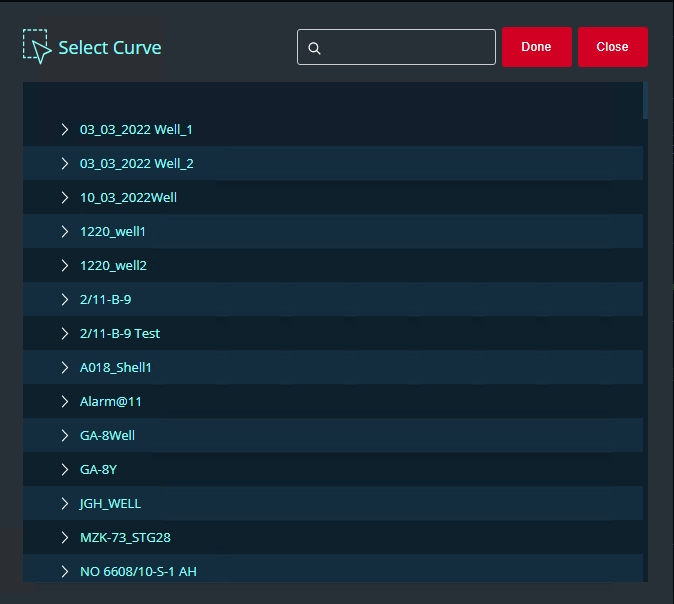
- Curve: When clicked on the 3 dots a popup window will be displayed as shown in the
Figure below
- It will display the all the wells,wellbores and curves user entitled to
- Select the required curve from the list . Users can also search for the same in the search box
- Once selected click Done
- Curve: When clicked on the 3 dots a popup window will be displayed as shown in the
Figure below
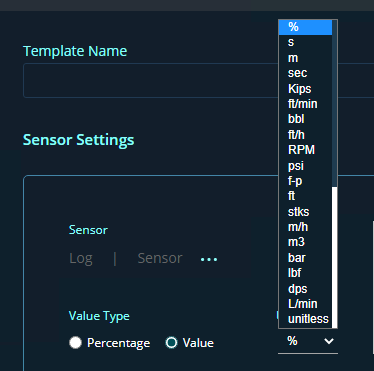
- Value Type
- Value type can be Percentage or Value
- Unit dropdown will be enabled only on selection of value type 'Value'
- Based on the selected value type alarm severity values can be set in the next section
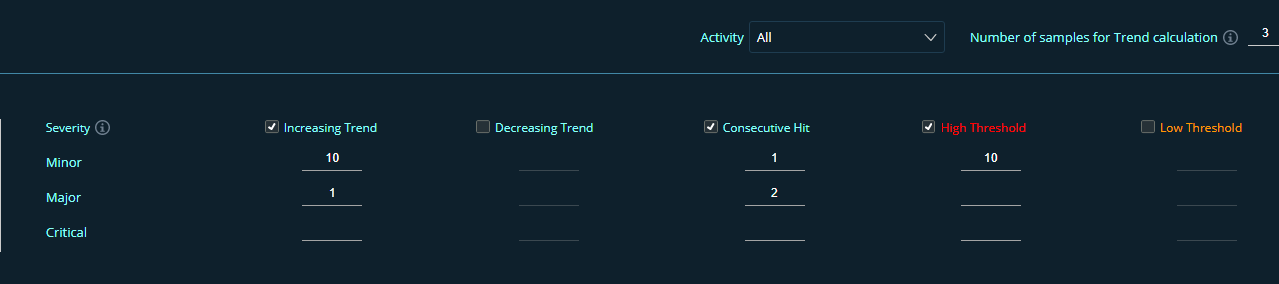
- Severity
- This section outlines the requirements for issuing Minor, Major, or Critical alarms.
- Users can set the limit percentage for Increasing Trend, Decreasing Trend, Consecutive Hit and direct values for High Threshold and Low Threshold.
- It is mandatory to configure atleast one of the severities
- If the user is entering values for Increasing Trend/Decreasing Trend then user should enter Consecutive Hit value
- Consecutive hit is not mandatory for High Threshold and Low Threshold
- The user can configure the number of consecutive hits required on a percentage increase or decrease in trend to define severity levels.
- High Threshold and Low Threshold:
- Actual threshold values can be entered here. Application will check for breach of the threshold value and trigger the alarm accordingly
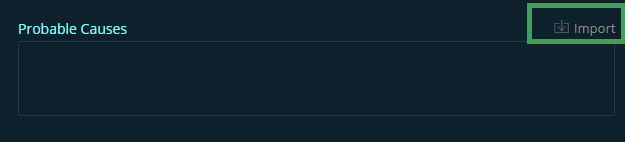
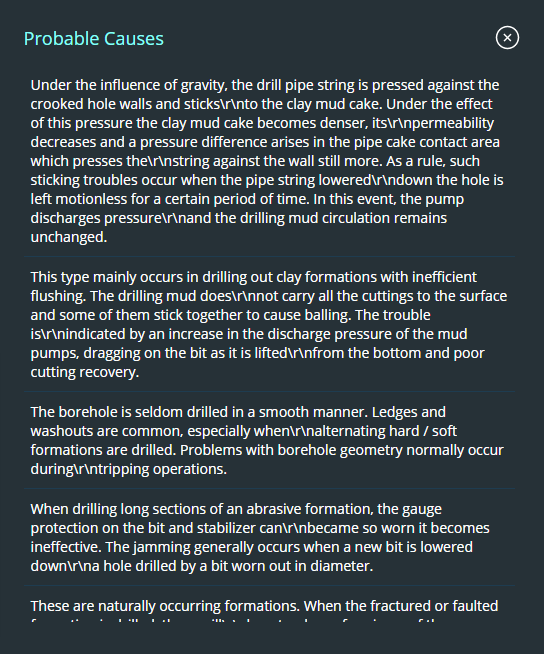
- Probable Cause
- This is a free text field where the user can input the most likely cause of the alarm.
- The import button in the upper right corner of the likely cause text field opens a window (Please refer to the Figure below) where the user may pick an appropriate probable reason from the list.
- Recommended Solution
- Here users can mention the solution to the issue or alarm raised.This section is free to edit
- Once the details are added users can choose to Publish ,Save or Close the template.
- Save Button: The template will be displayed in the Alarm template screen with private access
- Publish Button: The template will be listed in the Alarm template screen with public access , and visible to everyone who has access to this application
- Close Button: To quit the New template page click close
INFOwhen a user saves an existing alarm template after editing, it gets saved as a private copy.It will not update the parent template. If the user publishes the edited template the application will check for parent template and merge the changes to the parent template .
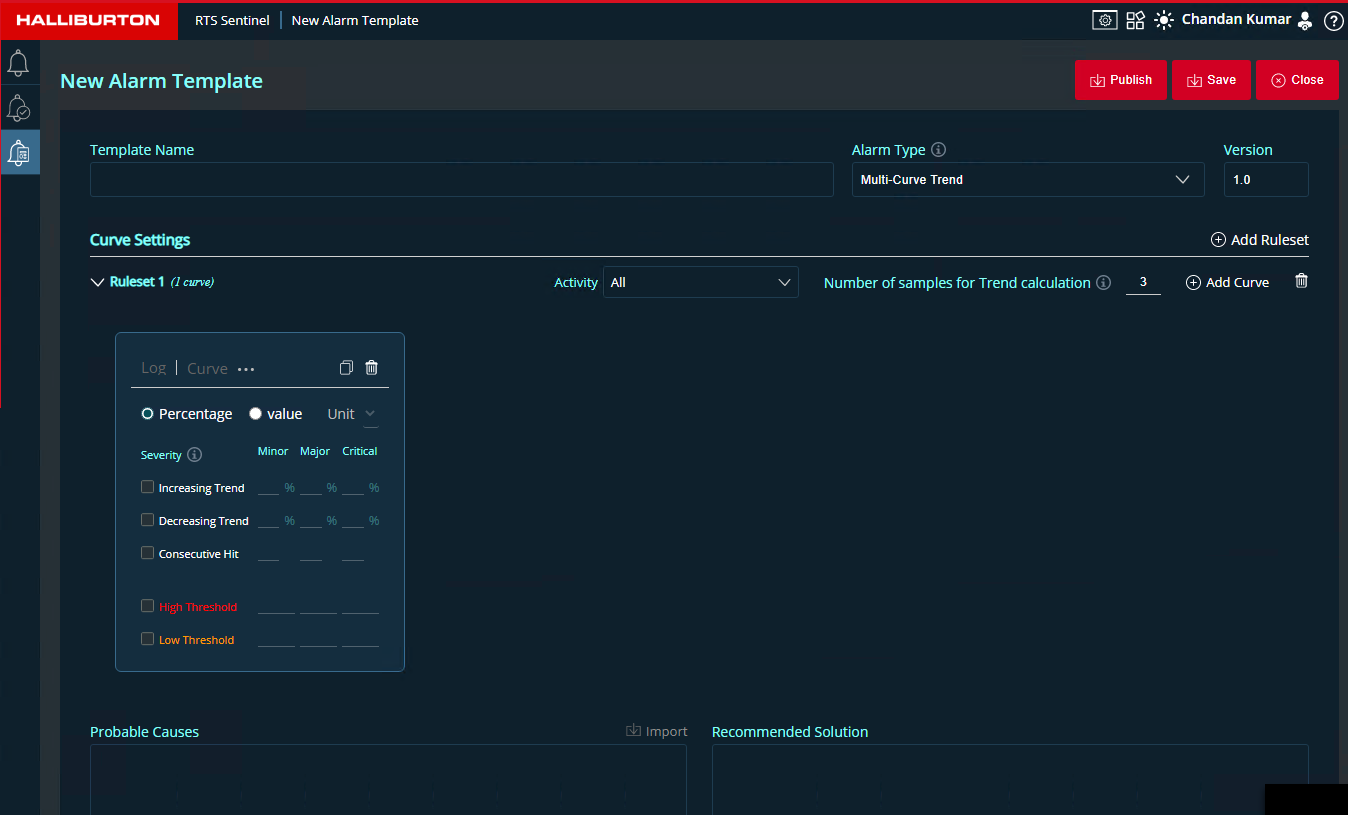
Multi-Curve Trend
To create a multi-curve trend, follow the steps below. Users can configure multiple sensors here. By default, when multiple -curve trend is selected a ruleset with 1 curve card will be displayed in the curve settings section

- Enter Template name
- Select Alarm Type as Multi–Curve Trend
- Enter the Version number
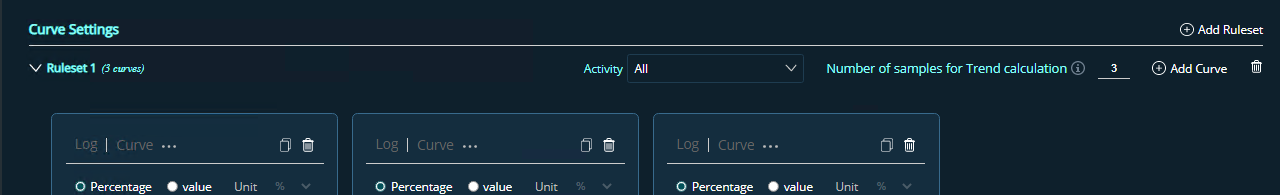
- Curve Settings
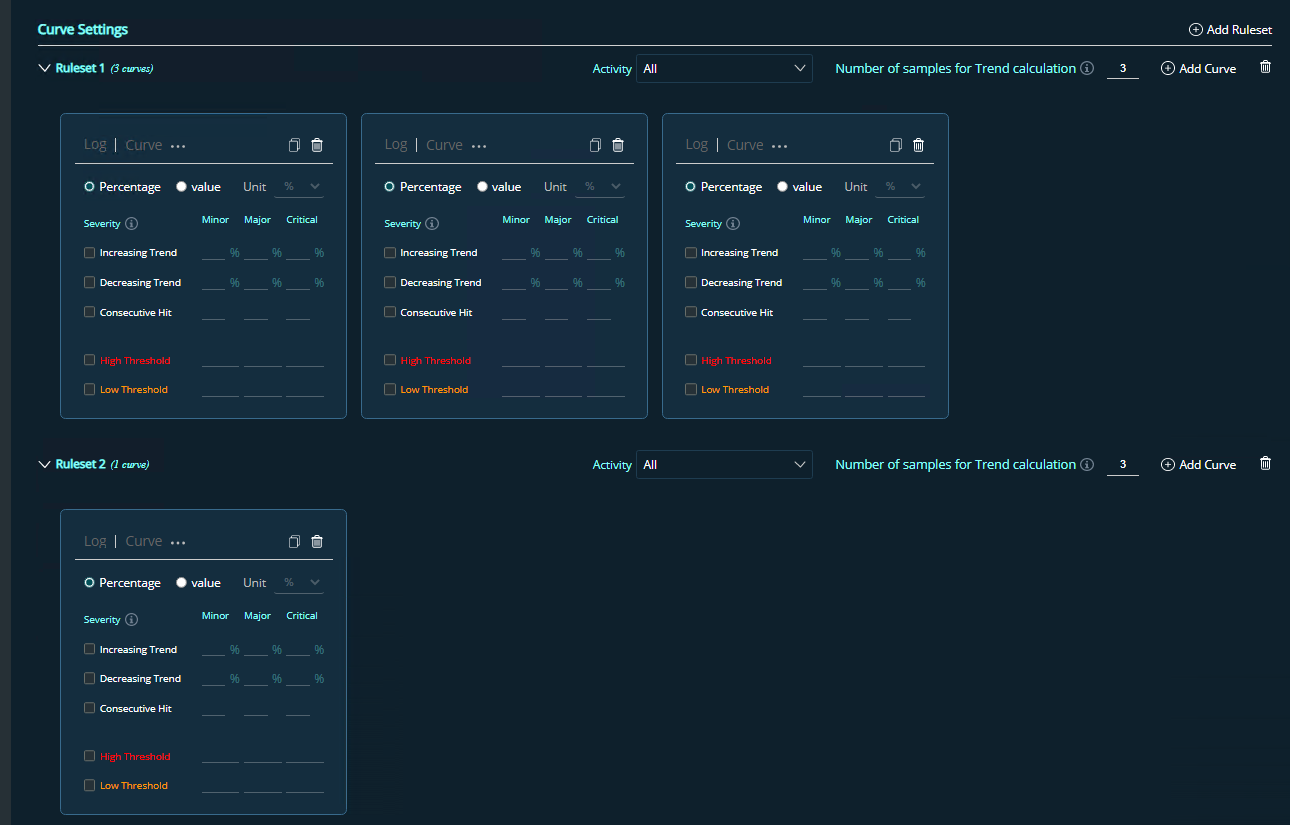
- Click on Add Ruleset button at the top-right to add the rulesets
- Click on Add Sensor button to add curve cards inside rulesets
- Ruleset features
- Activity
- Number of samples for Trend calculation
- Add Curve button
- Delete button: To delete the entire ruleset
-
Curve Card features
- For each curve card ,user can select required log and curves by clicking on the 3 dots. This will open a pop-up window named Select Curve with list of wellbores, logs and curves
- Copy button is available for users to create a copy of the curve card
- Delete button is available to delete the curve card
 NOTE
NOTEWhen multiple curve cards are added to the ruleset, the AND operation is performed to compare the curve cards' values. Across the rulesets, the OR operation is used. If a value is reached after being validated inside rulesets and across rulesets, an alarm is raised.
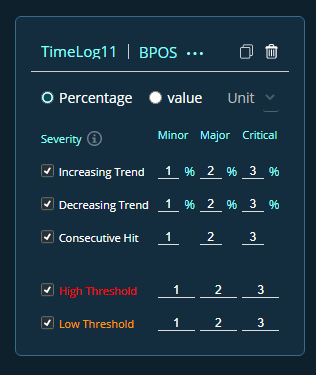
- Same as single-curve trend here user can select the Value Type from Percentage and Value
- If value is selected, then the Unit will be enabled and from the dropdown list user can select their required units
- Severity values can be enetered here
- Increasing Trend : Value in percentage by default
- Decreasing Trend : Values in percentage by default
- Consecutive Hit : No of consecutive hits can be entered
- High Threshold : Direct values can be entered here to set the limit
- Low Threshold : Direct values can be entered here to set the limit
INFOHere multiple rulesets can be added, and, in each ruleset, multiple curves can be added.
- Once the details are entered users can choose to Publish ,Save or Close the template.
- Save Button: The template will be displayed in the Alarm template screen with private access
- Publish Button: The template will be listed in the Alarm template screen with public access , and visible to everyone who has access to this application
- Close Button: To quit the New template page click close
INFOwhen a user saves an existing alarm template after editing, it gets saved as a private copy.It will not update the parent template. If the user publishes the edited template the application will check for parent template and merge the changes to the parent template .
- This is a free text field where the user can input the most likely cause of the alarm.
- The import button in the upper right corner of the likely cause text field opens a window (Please refer to the Figure below) where the user may pick an appropriate probable reason from the list.
- Here users can mention the solution to the issue or alarm raised
Configured Alarm
The configured alarm screen includes preconfigured alarms for the majority of common monitoring scenarios. Users can use alarm templates to customise predefined alarms or generate new alarms to fit particular monitoring scenarios. The configured alarms list can be viewed by users based on the wells to which they have access
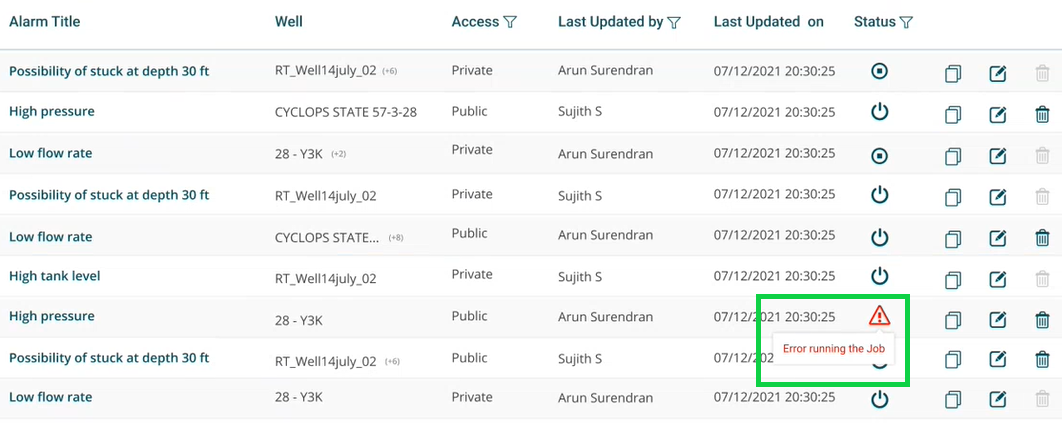
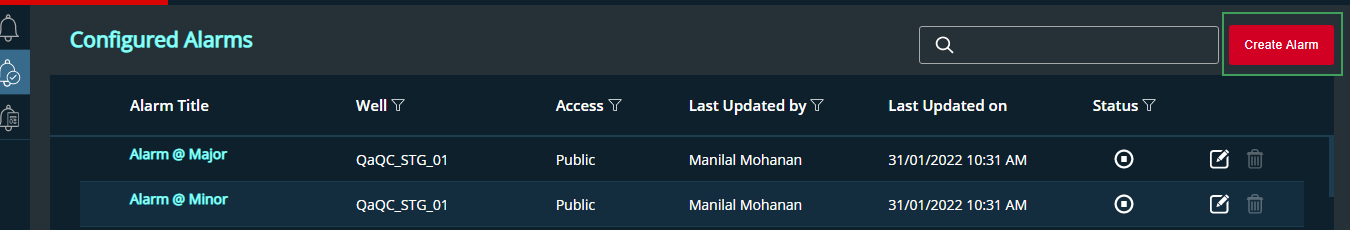
Figure below shows Configured Alarms screen.
- This page displays a list of configured alarms.
- Search functionality is available here.
- Click the Create Alarm button to add a new alarm..
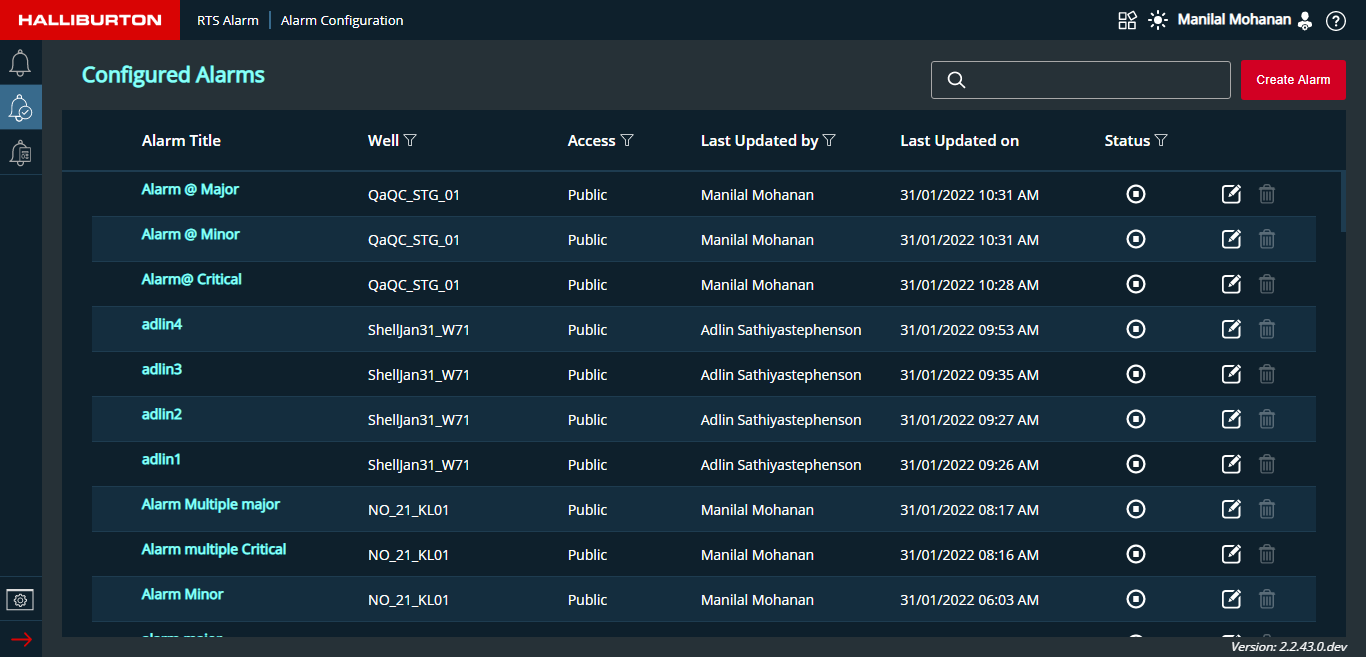
- This screen's headers are as follows:
- Alarm Title
- Well: Search and filter the required details
- The number of active wells chosen and their names are displayed when the numbers
displayed next to the well names are clicked.
- Access: A filtered list of alarms can be displayed depending on the selected filter settings, as shown in the figure below.
- Last Updated by: Filter the list by name of the user who updated the alarm.
- Last Updated on: Filter the list based on updated date
- Status: Filter the list using the status options shown in the figure below.
- When an issue arises while the task is running, the status button switches to error and, when clicked, displays a short error message.
- Copy, Edit and Delete button is available for each alarms
- When any of these configured alarms has any triggered alarms associated with it, system does not allow the user to delete that particular alarm.Delete button will be disabled.

Create Alarm
Users can create custom alarms if standard alarm templates do not cover all key events, situations, or state changes about which they need to be notified.
To create a new alarm, follow the steps below
Click on the Create Alarm button.
- New Alarm screen will be displayed.The alarm type single-curve trend will be displayed by default
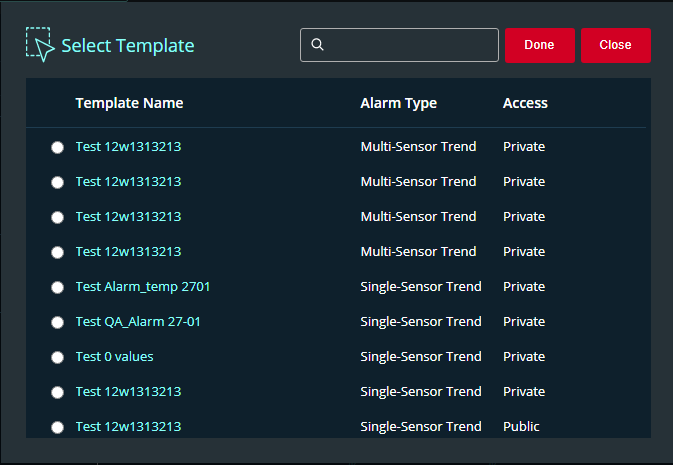
- To configure an alarm based on predefined template the user can click on Select Template button.User can choose from the list of alarm templates displayed
- When the template is selected all the fields are automatically populated based on the template values in the New Alarm screen.User can do the necessary changes if required
- User can change the alarm type to single-curve or multi-curve based on their preferences
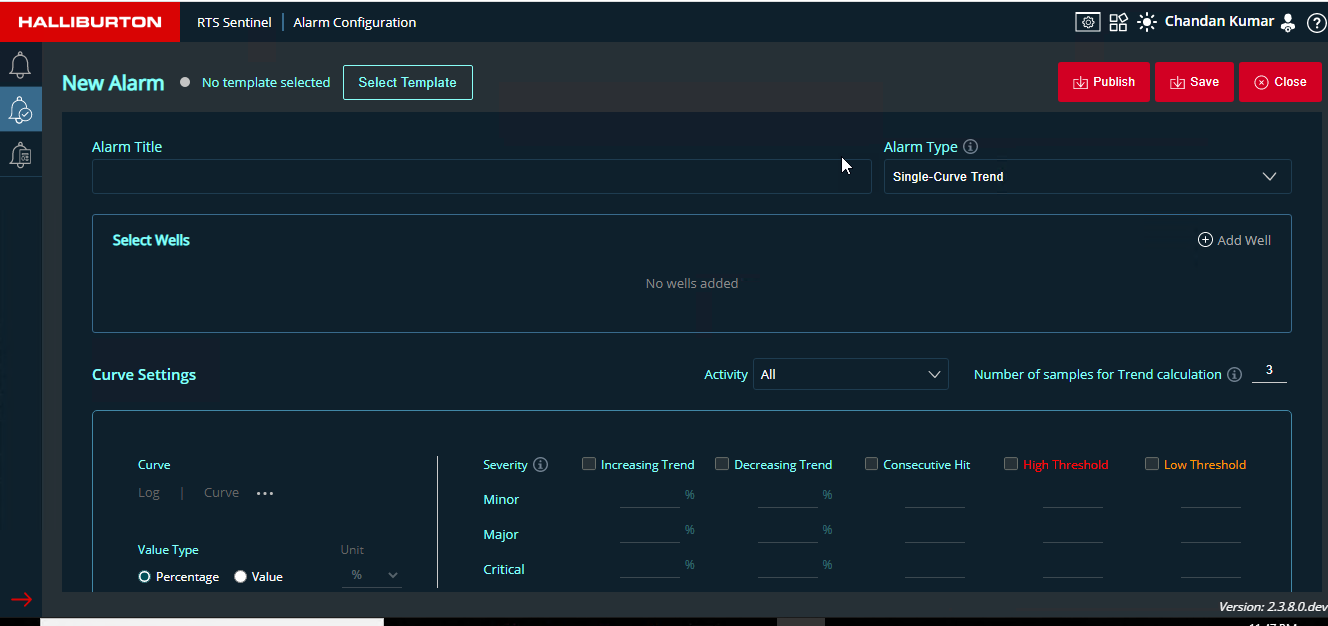
- Select Well from the list
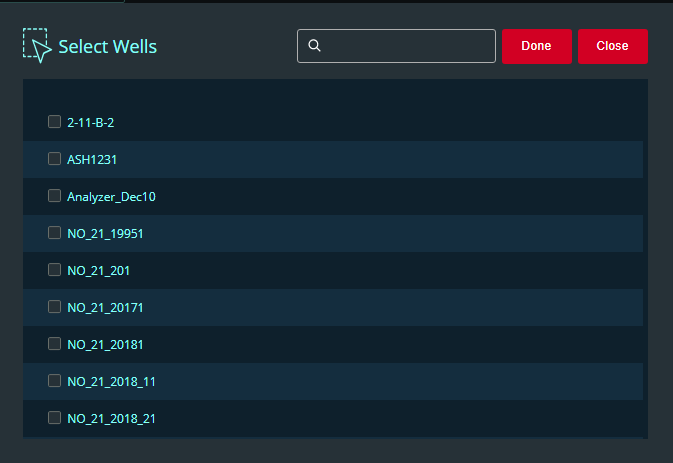
- Add Well button will be displayed at the right-end
- It will display a pop-up window named Select Wells from which users can select their required wells
- It will show the selected wells in the section with an enable/disable icon
- Here users have the option to remove or disable the selected wells based on their preferences.It will not trigger any alarm for the disabled wells.
- Once the wells are selected users can select the curves in Curve Settings
- Curves will be displayed based on Well selection in the Select Wells section
- Once the curve is selected from the list click Done and the selected curve will be diplayed under the curve field
- Search box is available
- Curve Settings details can be added based on the user requirement
- Once the Alarm is configured user can click the Save or Publish button and will be redirected to the Alarm List page
- Save : Alarm will be in private access
- Public: Alarm can be accesed by any of the users
- The alarm will be in the Stop state after it has been published/saved. If necessary, users can activate the Alarm.
New Alarm for Multi-Sensor Trend
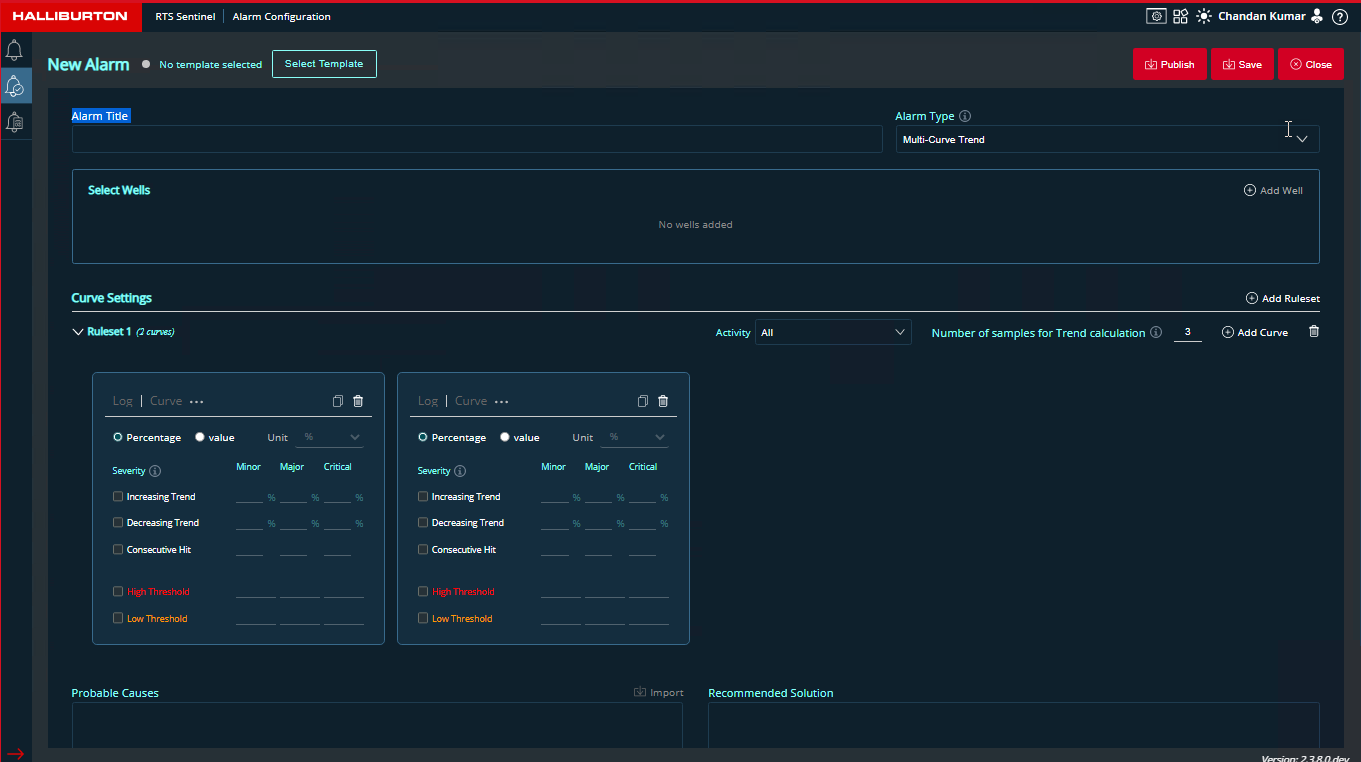
New Alarm Single-Sensor Trend
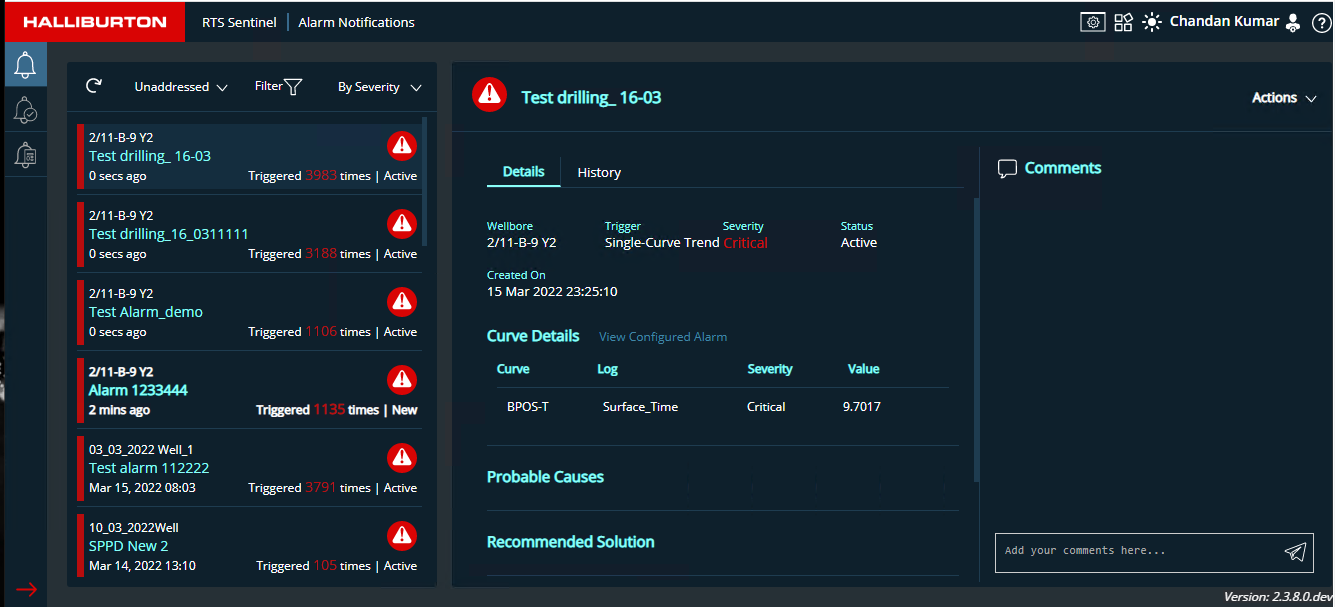
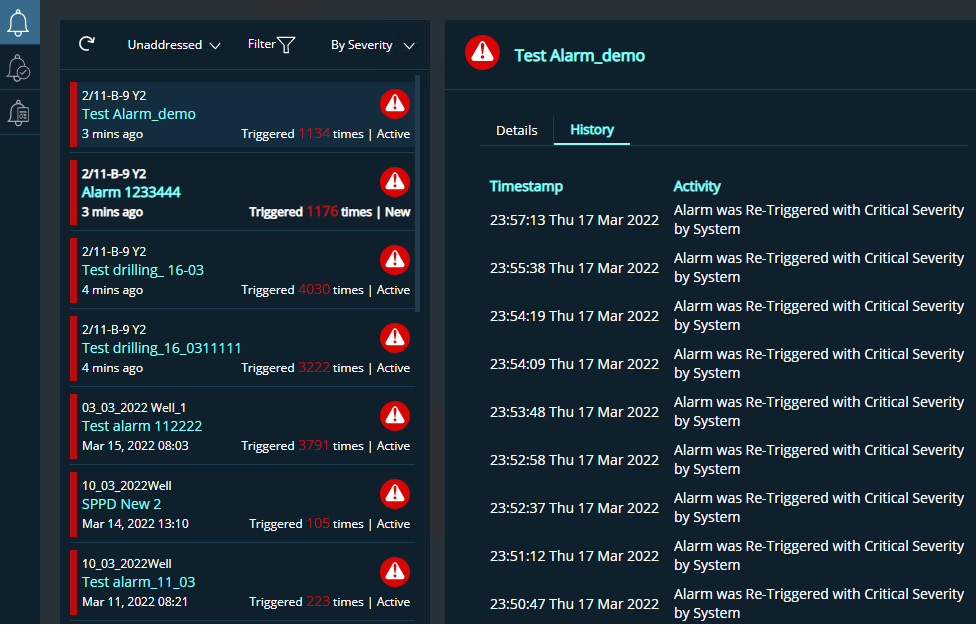
Triggered Alarms
This is the alarm notification screen which helps the users in monitoring the sensors.
- Triggered alarms are listed on the left pane.
- When an alarm is selected alarm name and details of that alarm will be displayed on the right pane
- Top bar of alarm details displays the Actions dropdown
- Comments section is available for users where they can enter their comment in the given text area , here Commented person's user name , comment and comment date will be displayed.
When an alarm is triggered it will be highlighted in yellow color for 3 seconds and then it will go back to the normal white color
Triggered Alarm List
Alarms will be displayed with Wellbore name, Alarm title, Status and Trigger count.Based on the severity a color bar will be displayed
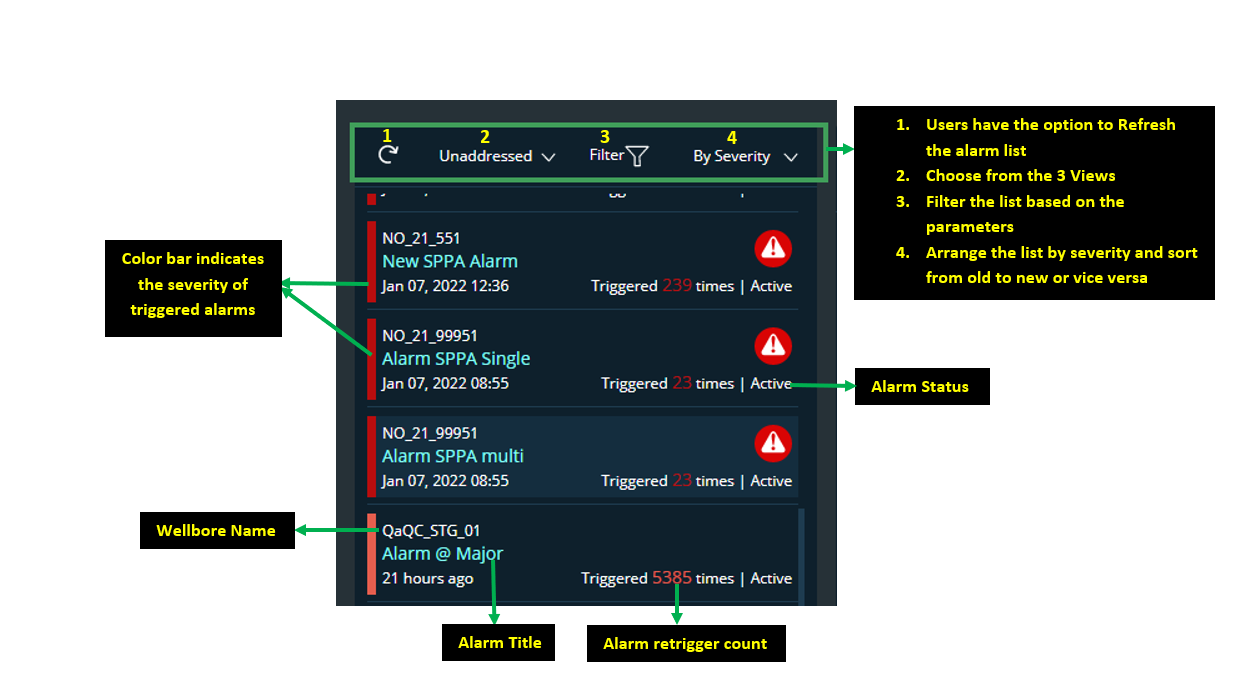
3 functionalities are available for alarm list section
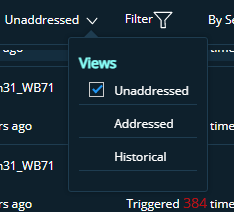
- Alarm views
- Unaddressed
- All new and active alarms will be listed here
- Addressed
- All alarms that are acknowledged and shelved by the user will be listed here. (Refer Alarm Details and History section for more details)
- Historic
- Alarms that are cleared or set as false alarm will be listed in historic view.(Refer Alarm Details and History section for more details)
- Unaddressed
- Filter
- Filter the alarm list based on the 3 views. 3 parameters are available for the 3 views: Severtity , Status and Wellbore
- Users can select wellbores from the filter in all 3 views
- Addressed
- 3 Severities are available: Critical,Major and Minor
- 2 Status are available: Acknowledged and Shelved
- Unaddressed
- 3 Severities are available: Critical,Major and Minor
- 2 Status are available: Active and New
- Historical
- 3 Severities are available: Critical,Major and Minor
- 2 Status are available: Cleared and False
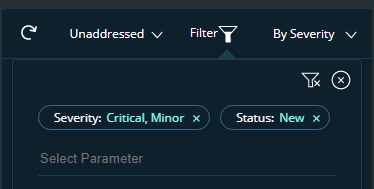
- Multiple values can be added to the filter list as shown in the figure below:
Filters in 3 views
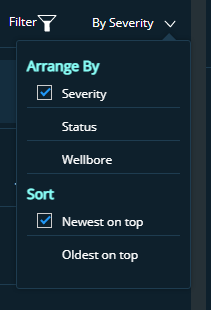
- By Severity
- Users can arrange the alarm list based on the severity, status, and wellbore
- Users can sort the alrm list from Newest on top or Oldest on top. Please refer to the Figure below
Color bar details
| Severity Color | Severity Type | Description |
|---|---|---|

|
CRITICAL | This alarm implies that quick action is required. If nothing is done, your system may suffer physical, permanent, and irreversible harm. Red is the default colour code. |

|
MAJOR | This alarm indicates that there are critical conditions in place. This feature has been severely harmed, and it is possible that it will be lost entirely. Your system will not be physically destroyed if no action is taken, but it will stop operating. The default colour code is salmon.. |

|
MINOR | This alarm indicates the presence of Error conditions. The functioning has been harmed to some extent, and you may experience certain issues. Your system is not physically damaged, but you must take steps to ensure that it continues to function correctly. Orange is the default colour code. |
Alarm functionalities
The details of an alarm can be viewed on the right pane when it is selected from the list.
- For every alarm two tabs will be displayed- Details and History
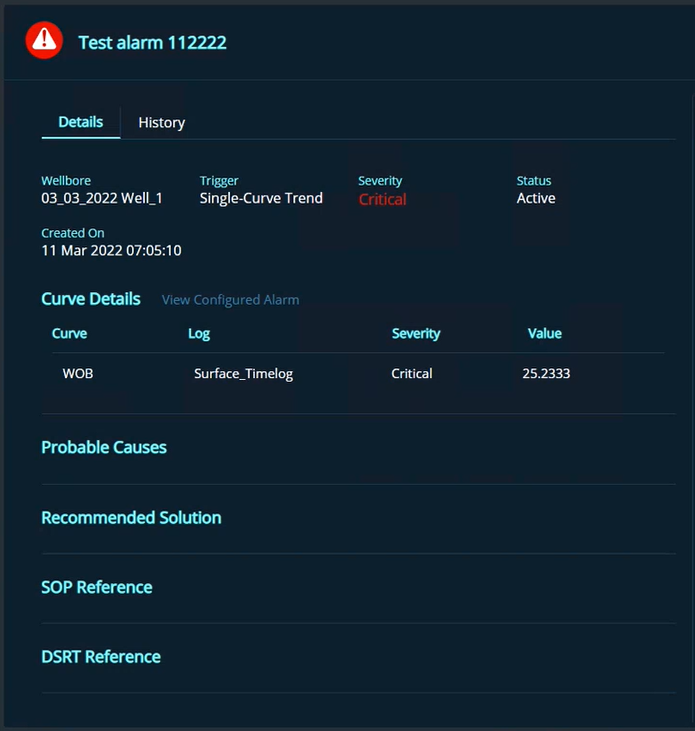
- Details Tab
- Wellbore- Wellbore name will be displayed
- Trigger- Trend details will be displayed here(whether it is multi-senor or single-senor trend)
- Severity- Type of alarm will be displayed whether critical/major/minor
- Status-New and Active state will be displayed if alarm is triggered for the first time later Actions taken on the alarms will be displayed as status
- Acknowledged By- Name of the User who acknowledged the alarm will be displayed
- Created On- Creation date and time will be displayed
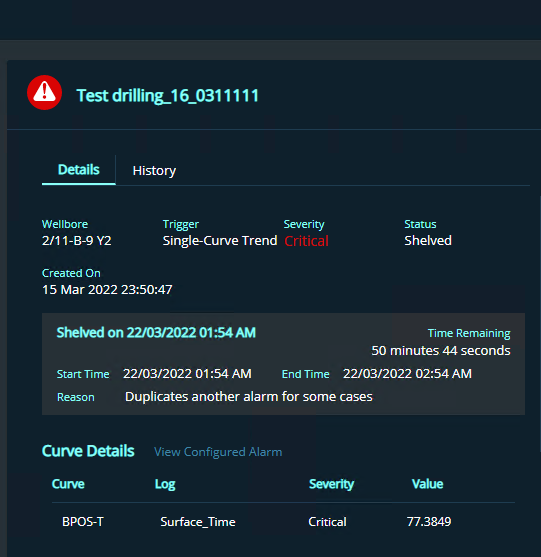
- Curve Details- Displays the selected curve details with curve name,log
name and value.If the trigger is multi-curve then rulename will be displayed
- View Configured Alarm link will help the user to navigate to the associated configured alarm screen
- Probable Causes- Probable cause will be displayed here for the users from configuration page
- Recommended Solution- Probable Solution will be displayed from the configuration page
- SOP Reference- If any link is configured for the triggered alarm it will be displayed here
- DSRT Reference-If any link is configured for the triggered alarm it will be displayed here
- History
The History tab displays the chronological set of actions performed on the triggered alarms, that helps the user to trace specific event , operation or procedure.
- Timestamp- Will show all the activity with time and date
- Activity- Display each activity with user details. Details from the most recent hours to old data will be displayed.
- Details Tab
Actions
- Actions dropdown has 4 options to choose from
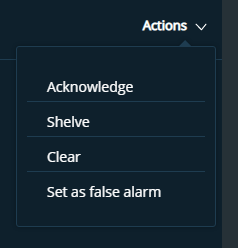
Acknowledge
- If the user view and acknowledge an alarm ,it will be moved to this list
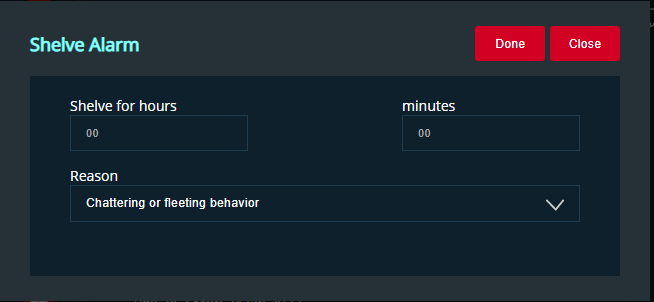
Shelve
- To shelve an alarm, click on the shelve option in Action dropdown feature (Refer Alarm Details and History)
- A pop-up window will be displayed
- Here, users can specify a time to shelve the alarms for a certain span of hours, as well as the reason for doing so.
- The reason can be chosen from a dropdown menu, or the user can fill in the data.
- Then click Done else Close the window
- Shelved Alarms will be added to the addressed view
- When an alarm is shelved it will be displayed in the Details tab with Start date, time and End date, time
- Reason for shelving the alarm and Time remaining to process the issue
- Once the alarm is fixed (Before/After the shelved time) user can take the respective action
- If the alarm is not fixed or no action is taken even after the completion of shelve time, alarm will be automatically moved to the unaddressed view.
Clear
- This action is to close an alarm after the issue is fixed
- This will be moved to historic view
Set False alarm
- Any alarm that is triggered and verified to be an invalid alarm by the user they can set it as false alarm and can move the alarm to historical view.
Toast Message
All the newly triggered alarms will be notified as a toast message for three seconds and will disappear.
Toast message features
- The user will be able to close the notification toast messages individually.
- The toast messages will be stacked with the new alarm on top of the list.
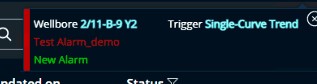
The toast message have the minimal information of the alarm:
- Wellbore Name for which the alarm was triggered
- The alarm type for which it was triggered
- The title of the alarm and the status of the alarm.