Data QA/QC
Software User Manual
Verson 1.3.0
Data QA/QC
Software User Manual
Introduction
The Data QA/QC application enables support personnel to detect data issues in RTS in real time. Remedial action can be made to rectify the data so that downstream applications can benefit from high-quality data.
This manual will walk you through the features and functionality of the DATA QA/QC application.
Access and Credentials
Users can access the application through web browser over the Internet.
Log in with your Halliburton credentials on the authentication page.
User Permissions
The user must be registered with OKTA and should have the authorization to access the application via OWAI.
Users will have access to the wells\wellbores which they are entitled to.
Application Features
Monitoring Screen
The wellbore monitoring screen displays the active wellbores (wellbores that are accessible to logged-in users) and allows users to monitor the real-time status/alerts/datagaps of all growing objects.
Curve Monitoring
This screen allows the user to monitor each curves.
Data Gap and Fixing
This screen allows the user to view the gap details.
Template
This screen will help the user to add/edit/delete template and configure the objects and their respective variables.
Wellbore Template
This screen will help the user to create wellbore specific template and configure the Logs, Trajectory, Mudlog and curves with respective of their need.
Source
This screen displays the server details.
Login Page
The RTS Appstore applications have a common login page were users can enter their credentials to access the application.
Users can access the system using Halliburton id, however the data is displayed based on the logged in user's access to the wells/wellbore.
Please follow the below steps to login to the application.
- Login to the application using HAL ID
- You will be directed to the landing page once you have successully logged into the system.
- You will be prompted with error messages when:
- Username is blank
- Password is blank
- Incorrect HAL ID or password

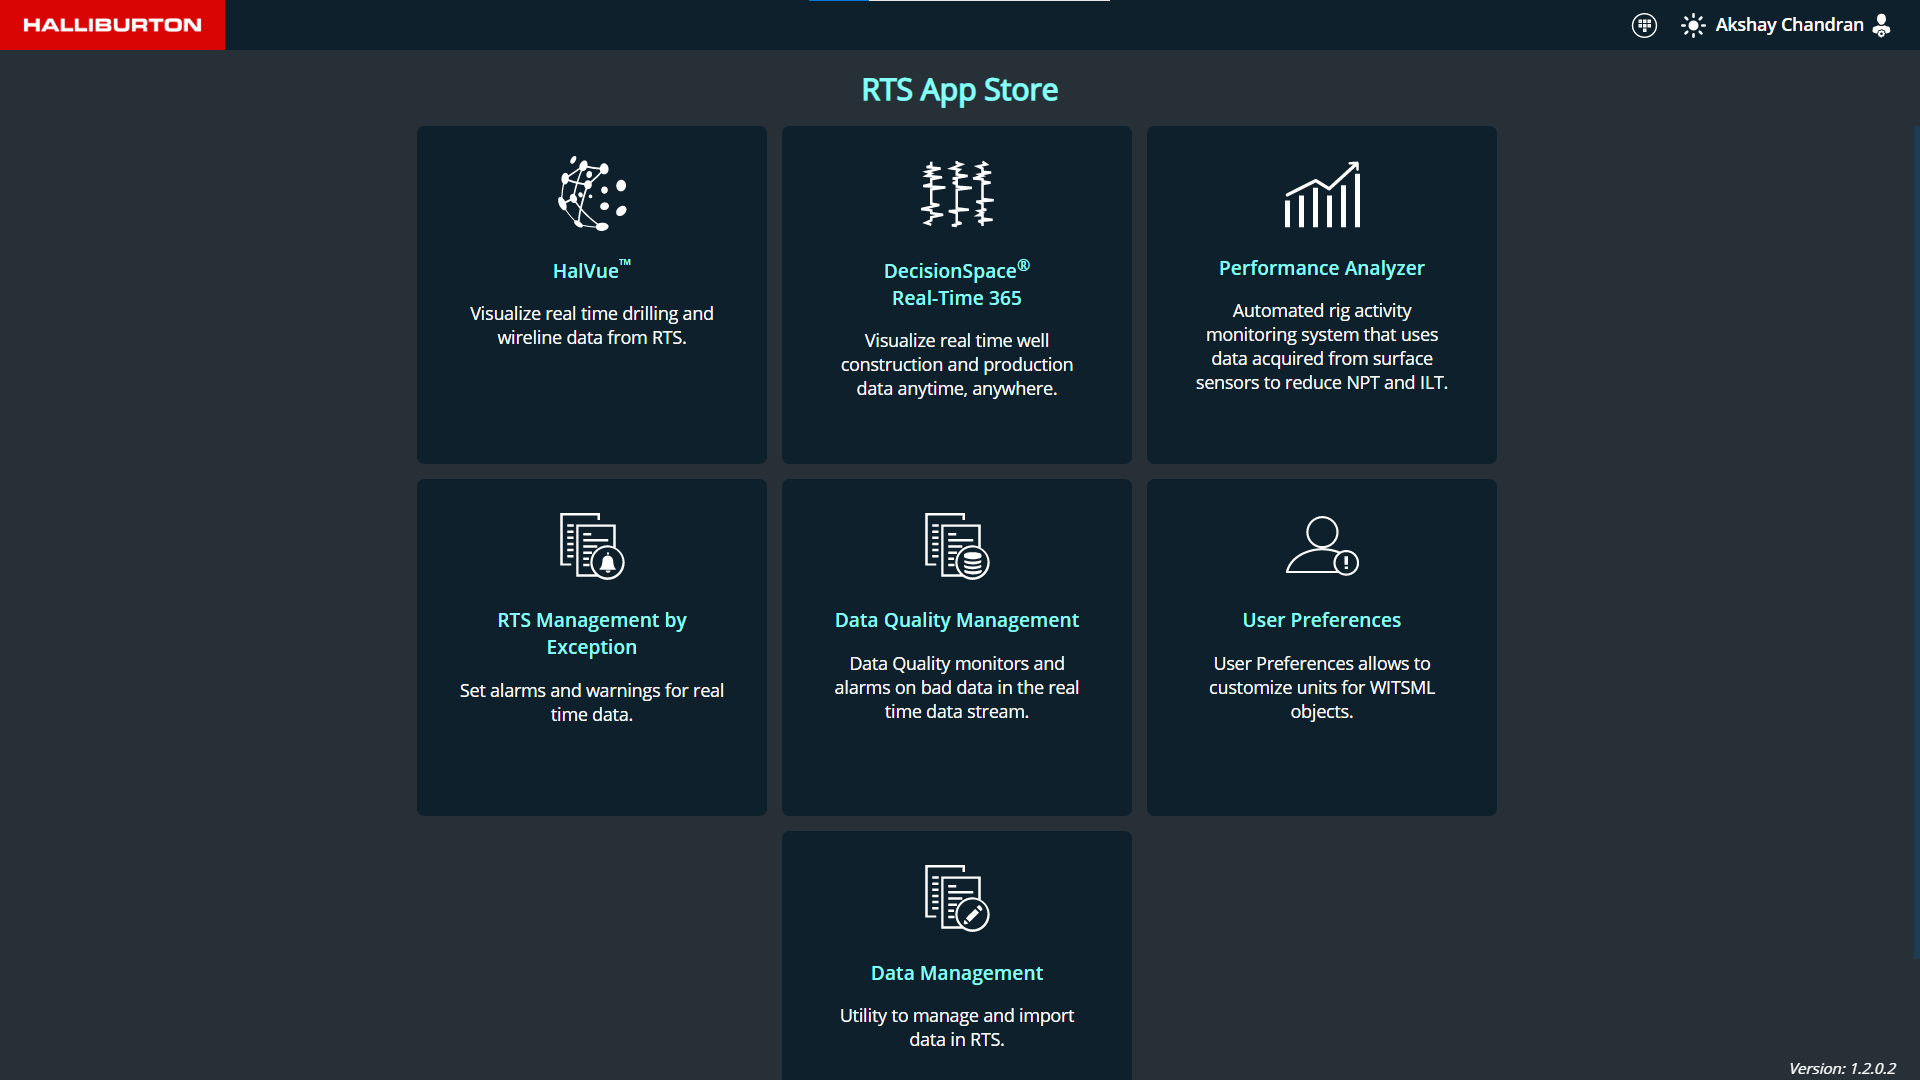
Home Page
This is the RTS Apps home page. The user is redirected to the Data QA/QC application page when they click on the operation card Data Quality Management.. The menu bar will become visible on the left pane.
Menu
This application has 6 menu items.
- Data Quality
- Curve Monitoring
- Data Gap & Fixing
- Template
- Wellbore
- Source
Menu bar can be expanded/collapsed based on the user preference by clicking on the arrow button at the bottom.
Theme
The application theme can be toggled between day and night theme based on the user's preference by clicking on the theme button on the top-right of the title bar.
Application Topbar
Top bar buttons
- PageReload Button (Available in first 3 screens as shown in the figure below)
- Dasboard button
- Appstore button
- Theme Button
- User Name and Logout button
Monitoring Screen
This is the RTS QA/QC monitoring Page where users can monitor the growing object status configured in the system. Refer to the figure below
- Monitoring screen grid headers are:
- Operator
- Well/wellbore Name will be displayed
- Data Source details will be displayed
- Service Type will be displayed
- Time Log
- Depth Log
- Trajectory
- Mud Log
- Data Gap Fill
- Wellbore monitoring details are displayed in the grid
- If the grid has no data available, it will display “No data available.”
- Color Legends are displayed on the top which is helpful in showing the status of the data flow
:
- Users can utilise the filter functionality to narrow down the list depending on Operator, Wells,
and Wellbore.
- By ticking the box, you can filter your favourite wellbores based on well and operator.
- If filters are applied, the filter button will turn white.

- Users can use the search functionality to look for well and wellbores names
- WITSML and ETP connection status will be displayed inside the HEARTBEAT box next to the
search bar

-
Green
Connection is Stable -
Red
Connection has Issues -
Grey
Inactive
-
| Icons | Color Legends | ||
|---|---|---|---|
Time Icon

|
Red:Gap identified |
Green:No Gap identified |
Grey:Inactive |
Real Time Icon

|
Red:Real Time streaming Stopped |
Green:Real Time streaming Active |
Grey:Real Time streaming Inactive |
Alert Icon

|
Red:Alert type is High |
GreenNo Alert is triggered |
Yellow:Alert Type is Low |
Grid Details
| Fields | Description |
|---|---|
| Operator |
|
| Favourite Icon |

|
| Well\Wellbore |
|
| Data Source |
|
| Service Type |
|
| Growing Objects displayed here are Time log,Depthlog,Trajectory and Mudlog | |
| Time log |
|
| Depth log |
|
| Trajectory |
|
| Mud Log |
|
| Data Gap Fill |
This column will display the data Gap fill status with count of each wellbore to be
monitored
based on the data streaming.

|
| Configure Icon |
Sample Report (For reference purpose) 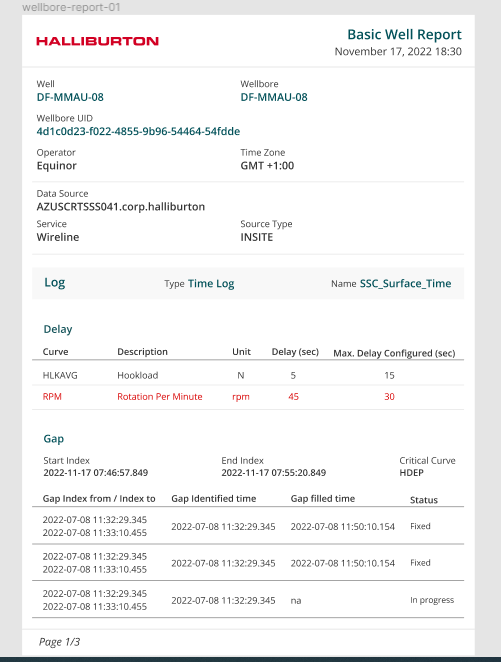
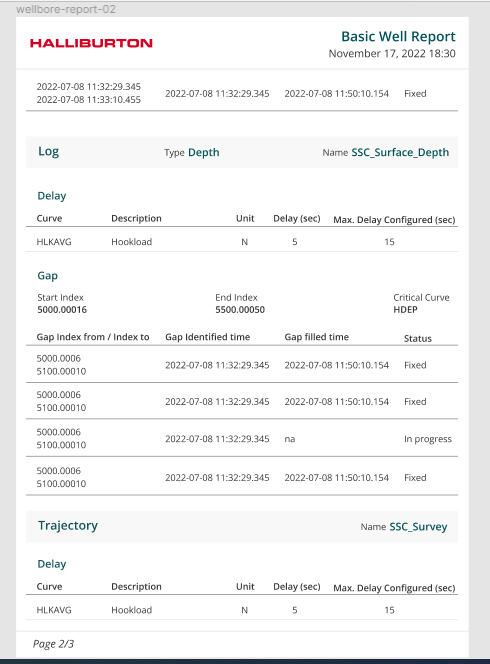
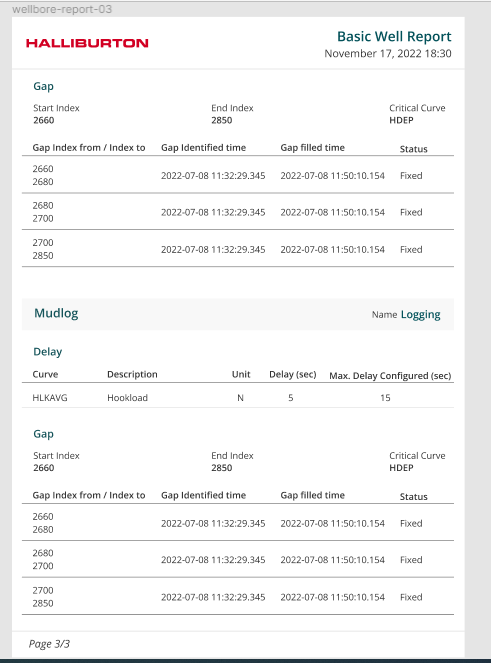
The downloaded report will be titled Well\Wellbore name. The pdf report will include all of the information available in the wellbore. Please refer to the figure below 
|
 - Clock
icon indicates historical gap . it will be red in color if a gap is
detected.
If no gap is detected it will be in green color
- Clock
icon indicates historical gap . it will be red in color if a gap is
detected.
If no gap is detected it will be in green color  - To show
the status of object whether it is streaming in real time or not.
It will be in Green when the streaming is happening continuously, and it
will be in Red when it is identified as streaming stopped.
- To show
the status of object whether it is streaming in real time or not.
It will be in Green when the streaming is happening continuously, and it
will be in Red when it is identified as streaming stopped. -
Wellbore Specific Templates
-
Wellbore Specific TemplatesSorting Grid information is performed by clicking the arrow button adjacent to the grid headings.
- Operator,Well/Wellbore,Data Source,Service Type: Sortable in ascending/descending order
- Time Log,Depth Log,Trajectory and Mud Log:
- Initially, problematic data will be displayed during sorting.
- Following that, live data will be displayed.
- Inactive data will be displayed later
By default, problematic data will appear first in the grid when the screen is refreshed.
Alert Details
- Triggered alert details can be viewed by expanding the button next to the operator
- Alert Grid Headers:
- Triggered Date Time: Display the alert triggered date and time
- Object Type: Filter is avaialble to select and display alerts based on object type. Multiple selects can be done.
- Curve\Logname: Log name will be displayed based on the selected template
- Start Index: Start Index value will be displayed
- End Index: End index value will be displayed
- Alert Type: Users can select from 5 options of alert type . Filter button is
available to select and display alerts based on alert type.Multiple selects can be done

- Log not growing (Time and Depth): When real-time curves data is not flowing from RTS or logs are not growing, an alert will be send to the user.
- Log growing (Time and Depth): When real-time curves data is flowing from RTS an alert will be send to the user
- Out of range data: If curves deliver data that slips beyond the range(Refer template screen - Min and Max value provided in Monitor curves), an alarm is displayed on the screen.
- Time Jump: If time log data shows a future time index, this is referred to as a time jump.
- Depth Jump: Depth jump occurs when the depth log exceeds the hole depth
- Double Data Points: To check whether data points appear more than once in one second. An alert will be issued if a data point occurs more than once.
- Duplicate Index: To check whether a duplicate of the same data point occurred.


Curve Monitoring
Users may keep track of the curves for each wellbores here. The curves are categorized based on the log(Depth,Time,Trajectory,Mudlog)
- The curves for the new wellbore will be auto populated in this screen dependent on the log.
- Items monitored here are time, depth, mud log and trajectory
- Functionality
- Sort: Users can sort Wellbores and Data Source
- Show Wellbore
- Favourites: User are allowed to select their favourite wells (It is not dependent on the favourites option on the monitoring screen.)
- All
- Show Curves
- Stoppage
- Streaming
- All
- If the curve is not streaming, the colour changes to red; once the real-time streaming is detected, the colour changes to green.
- Color legends followed for curves :
- Green : Active
- Red : Stoppage
- Grey : Inactive
- To navigate to the template screen click on the Wellbore name. If template is assigned to the wellbore user will be navigated to the template screen.Please refer to the Figure below

Users can sort the Wellbore Name ,Data source and Item Monitored
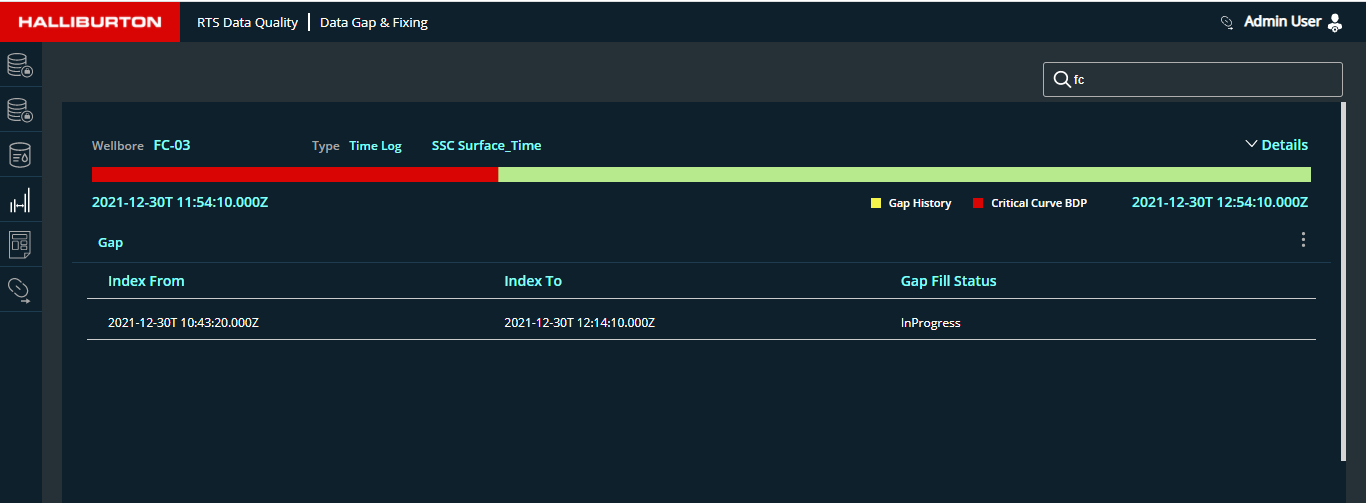
Data Gap and Fixing Screen
This screen allows users to view the specifics of the data gap and how it is fixed. The screen displays the details of the gap indexes, of the selected time log, depth log, trajectory, and mudLog.
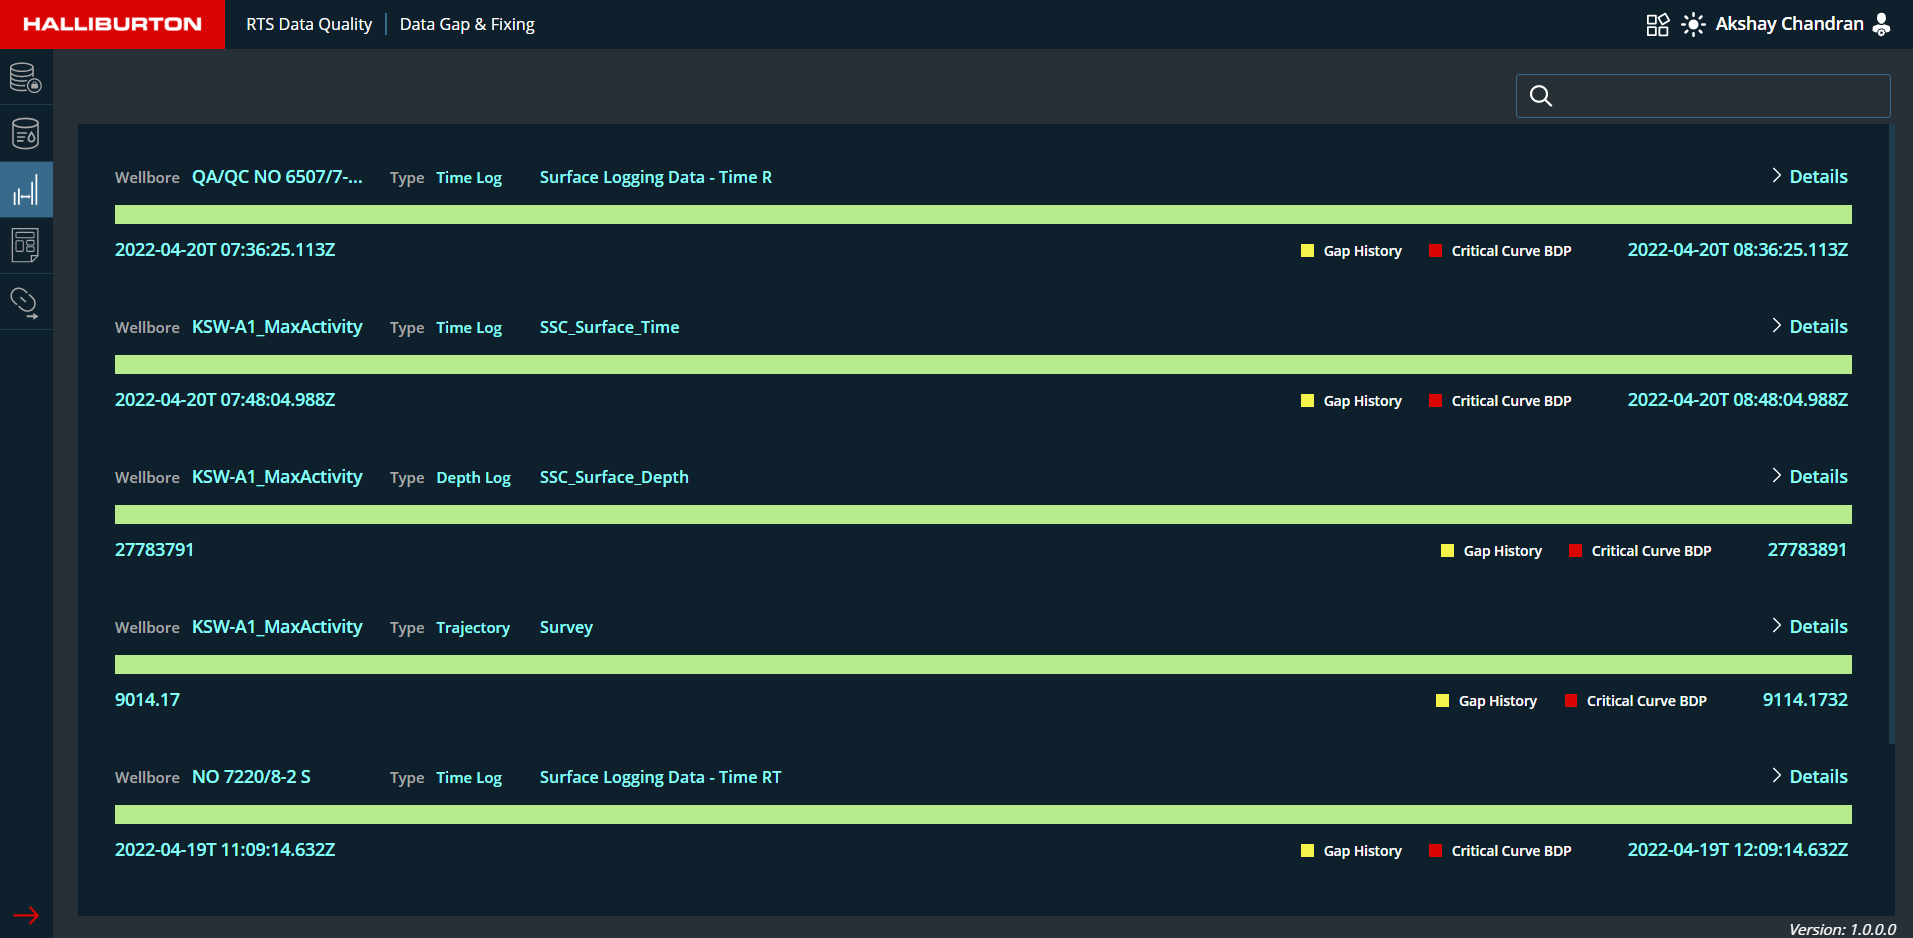
- A search functionality is given at the top of the screen, allowing the user to search wellbore.
- Following information are displayed inside the data gap and fixing section:
- Wellbore Name ,Log type and Log name will be displayed for the streaming data
- Based on the data streaming, each wellbore will display the color bar with a start and finish index.
- Color indication on bar :
- Green: Good Data (No gap identified)
- Yellow: Gap History (When the data gap is fixed ,the indicator will turn yellow)
- Red: If gap is identified (Critical Curve BDP)
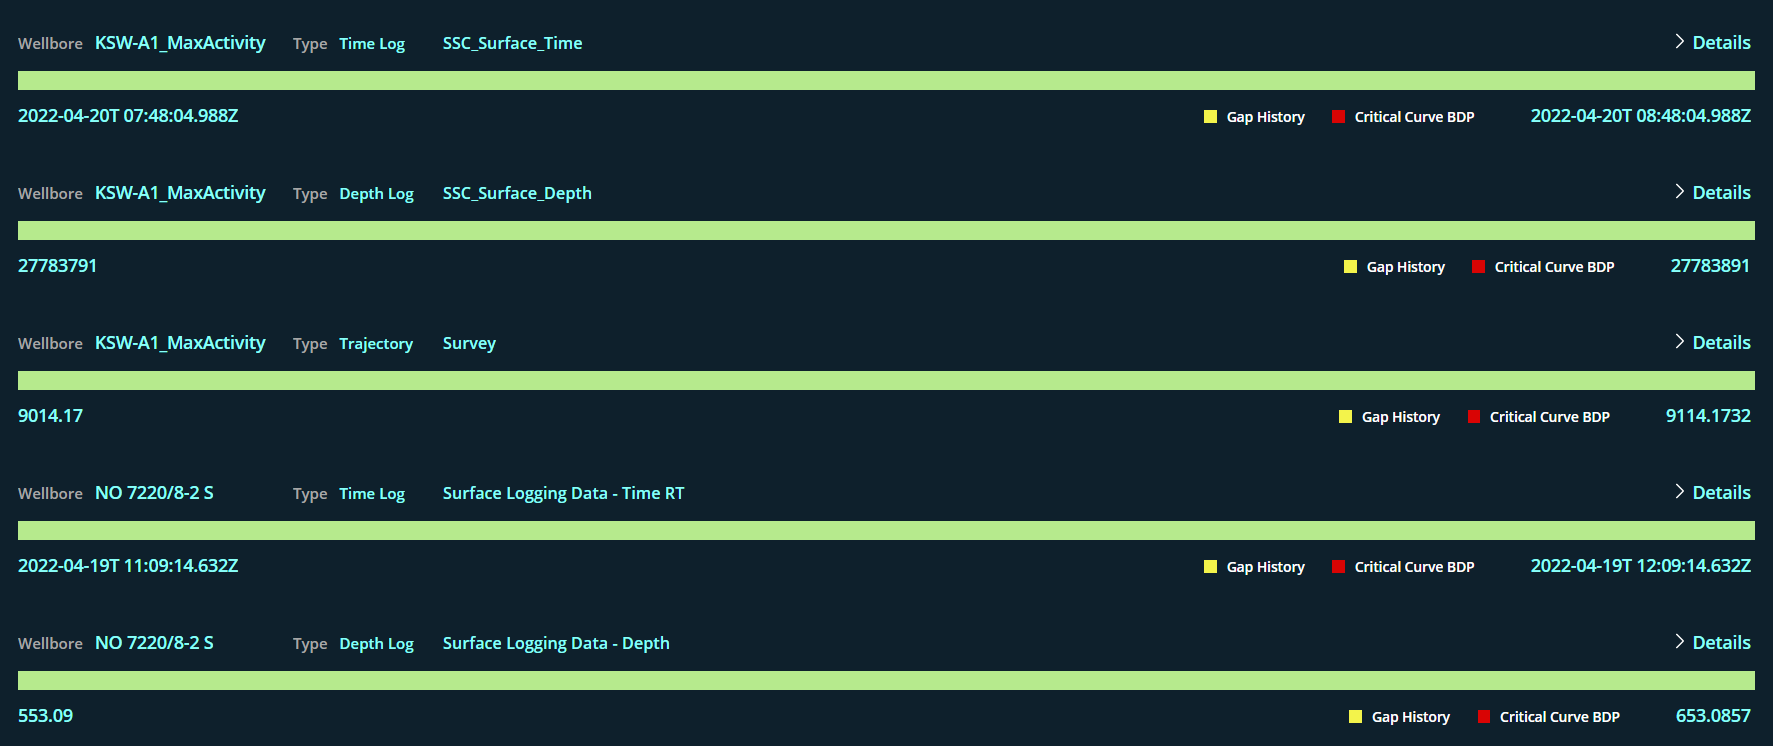
- 'Details' tag with an expand and collapse button is accessible on the right end of each Growing Object which enables the user to monitor the data gaps occured in the wellbore.
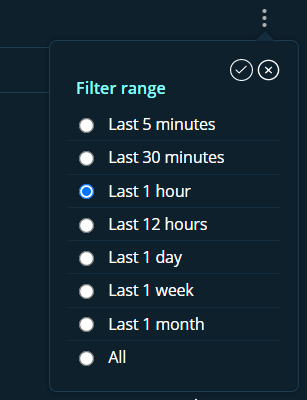
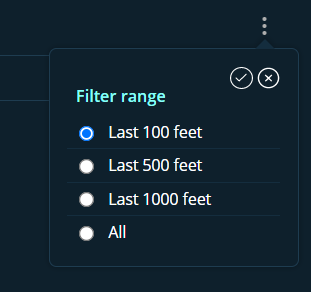
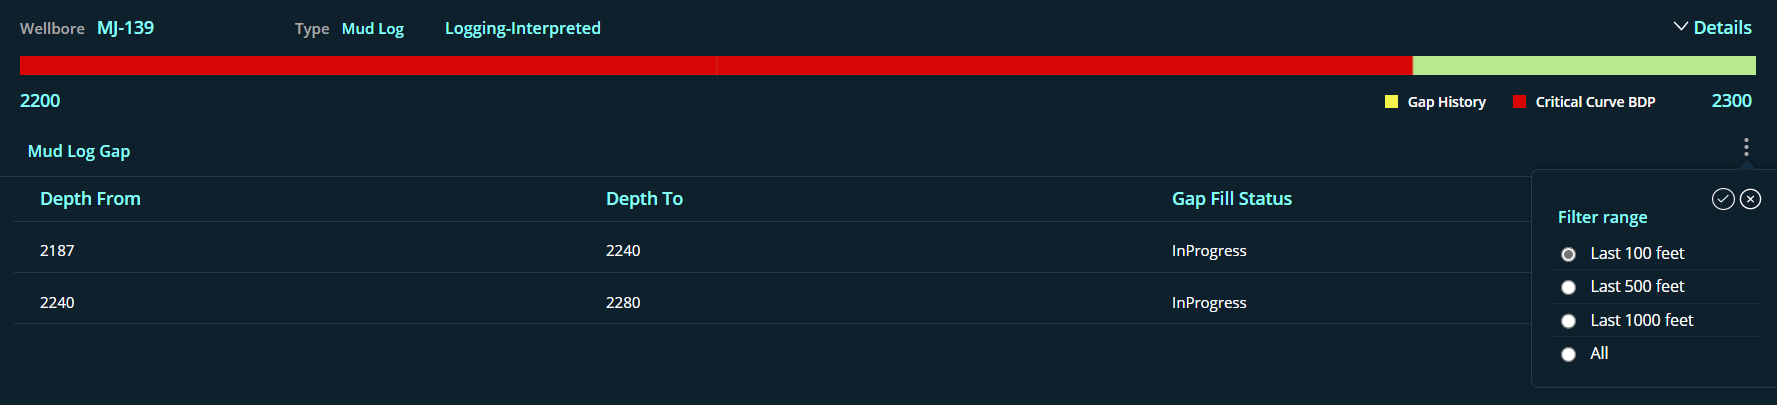
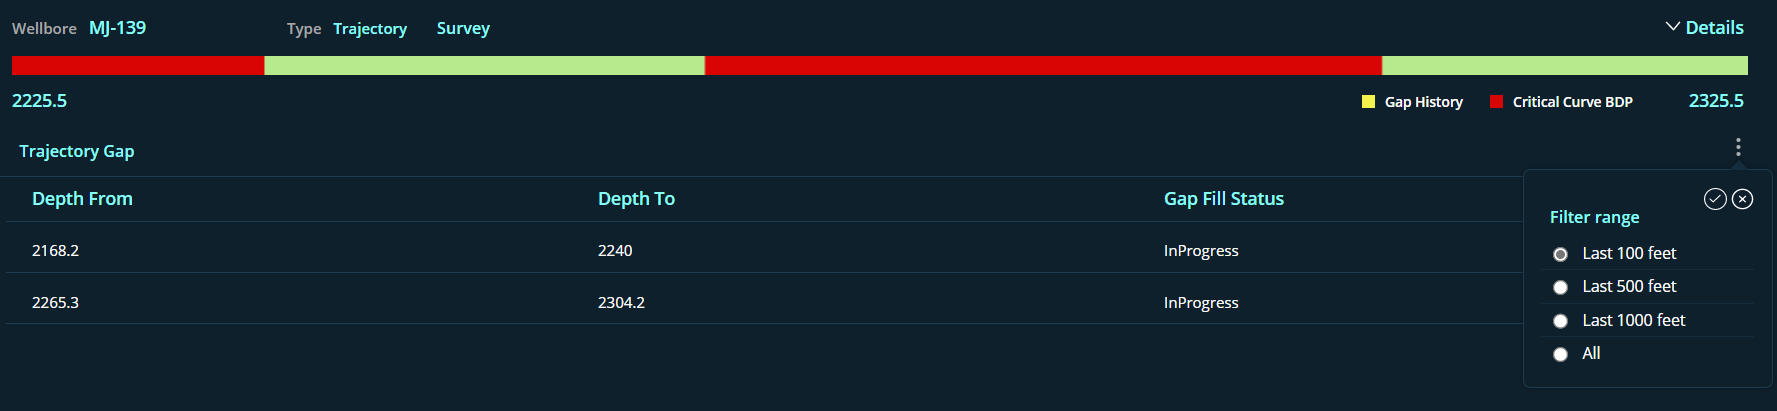
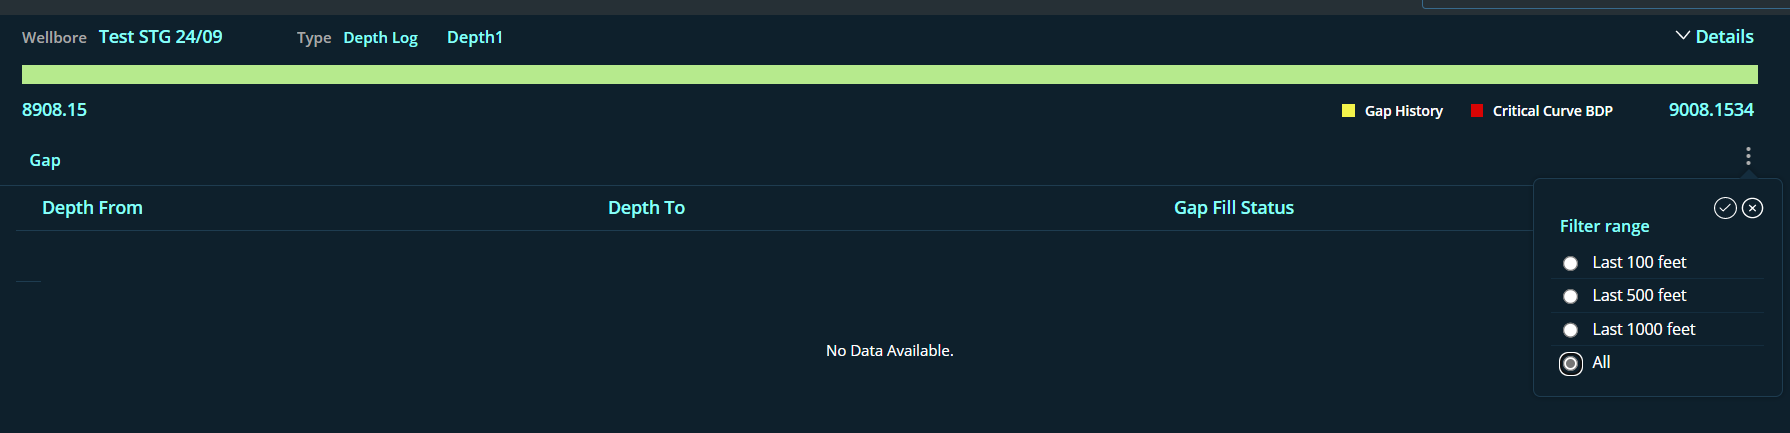
- Filter functionality is available in all details sections. Click on the 3 dots to open
the filter range window (Please refer to the Figures below)
- Default 1 hour data is loaded for time log.
- Default 100ft data is loaded for Depth log,Trajectory and Mud Log
- Gap: Display the identified data gaps in the logs with from and to indexes
- Index From: start index of the gap identified
- Index To: end index of the gap identified
- Gap Fill status: Status of gap fill will be displayed.
- InProgress : If the data gap is identified this status will be displayed and color turns red
- Completed : Once the gap is fixed this status will be displayed and color turns yellow
Time Log gap Details
Mudlog gap Details
Trajectory gap Details
Depthlog gap Details
Template Screen
This page allows the user to choose a template from the template list, or the user can create a new monitoring template for each operator. Configuration for Logs, Trajectory, Mud log, and curves will be included in the template.
- All templates with operator names are displayed on the left side of the screen. The user can delete an existing template from the list by clicking on the Delete icon.
- A search functionality is available in the template list for searching the template name and operator.
- Click the plus button to add new template depending on the operator.
- A collapse/expand button will appear on the right side of the pane to reveal the selected template information, which includes Monitor Time, Depth Log, Monitor curves, Monitor Trajectory, and Monitor Mud Log.
- Once the template is created click Save button to save the template configuration
- Users can duplicate an existing template by clicking on the Duplicate button
- Name of the template will be modified to: Copy of ***existing template name***.Users can rename the template.
- Users can edit the template and save
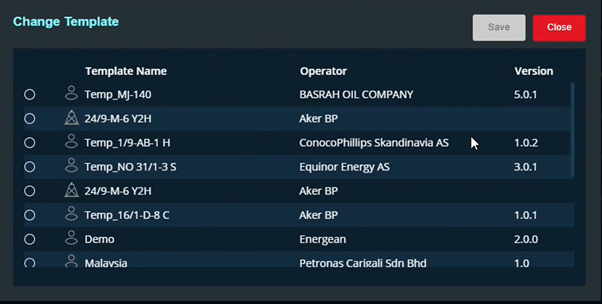
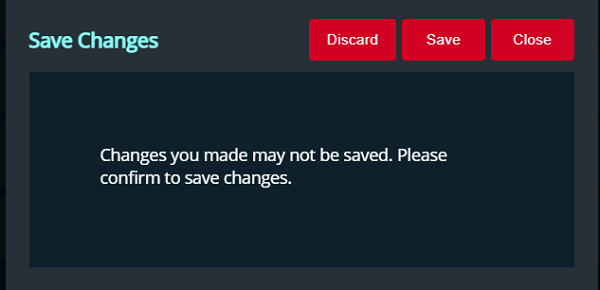
-
If the user attempts to open another template before saving the altered template,
a pop-up window will appear named Save Changes to confirm the changes in the edited template.
Please refer to the Figure below
Adding growing object details inside a template
| Fields | Description |
|---|---|
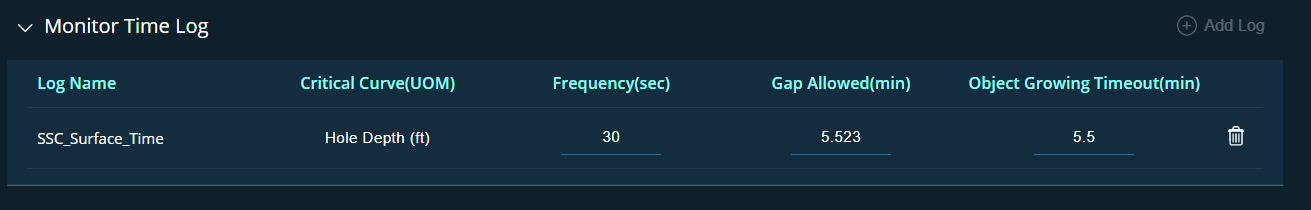
| Monitor Time Log |
This section contains the following fields that allow the user to configure the Time log.
|
| Monitor Depth log |
|
| Monitor Curves |
This section displays the following columns.
|
| Monitor Trajectory |
This section should display with the following columns.

|
| Monitor Mud Log |
This section should display with the following columns.
|
Users can Import/Add New curves for monitor curves. Only one row can be added to the rest of the items
Wellbore Screen
Wellbore screen aids users to change the configuration of wellbore specific templates.

- Left section of the screen displays the wellbore list with operator name
- Right section of the screen displays the template details of the selected wellbores
- Users can select the template form the Copy template from dropdown.Two types of templates
can be selected
- Welbore Specific Templates
- Service Provider Template
 INFO
INFOInitially, the dropdown list would only show service provider templates. When a wellbore-specific template is created, it will appear in the list.
- Once the template is selected the stored details of templates can be viewed/edited/deleted
- Users can do a quality check by activating the four options in .
Enable Quality Control Test. By default, all four options are checked
- Consistency Check -To check the time jump and depth jump
- Bad Data - Range Check
- Uniqueness Check - Duplicate check
- Timeliness Check - Double data points
Deleting a Template
- A pop-up window titled Delete Template will appear.
- Templates can be seen in the pop-up list. It will be classified as Wellbore Template and Service Template based on the icon.
- A checkbox is present next to the icon for Wellbore-specific templates.
- At the bottom of the pop-up, users are also informed that they are only permitted to remove wellbore specific templates.
- Select the required wellbore and press the delete button. A confirmation dialogue box will be displayed to the user. Select Yes if you want to delete the template; else, click Close
To delete a wellbore-specific template, click the delete button next to each template name in the left section. Only wellbore specific templates can be deleted
Please refer to the figure below
Quality check for Service Provider Templates : Quality check for these templates are done by default.Manual check is not required
Saving Wellbore Templates copy : The same wellbore template can be saved multiple times. Each time the name would be suffixed with an incremented number
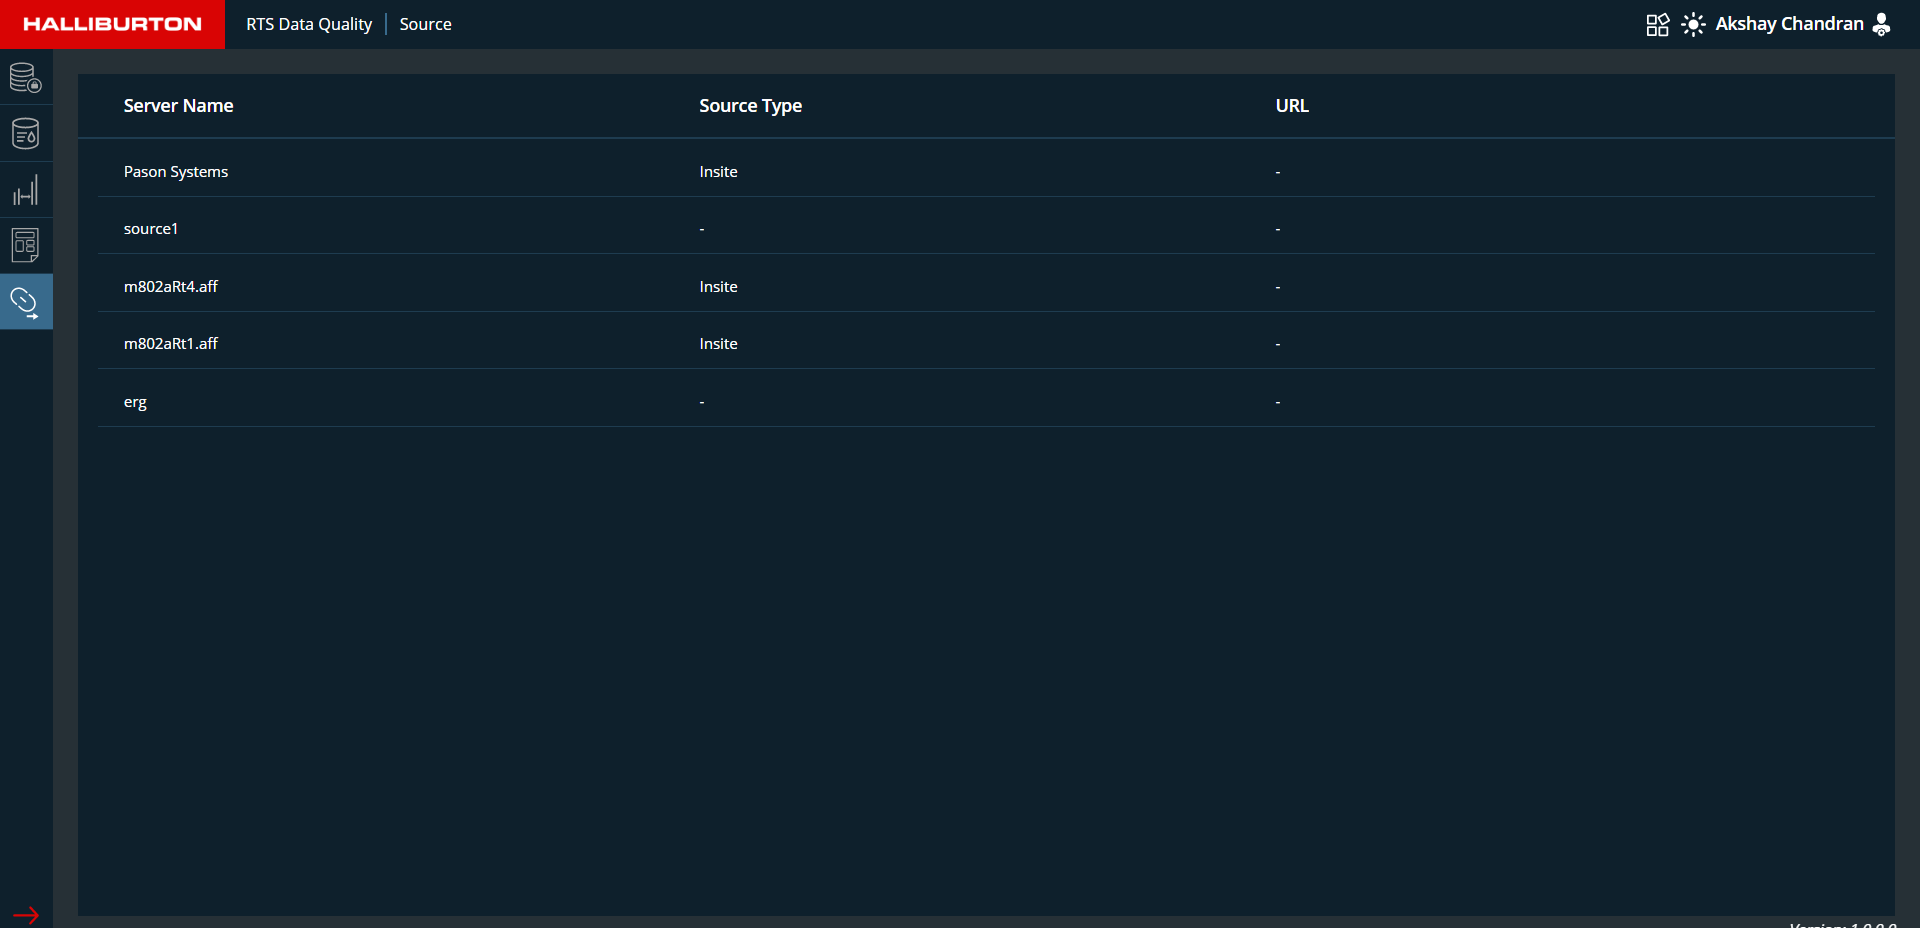
Source Screen
The source screen is read-only. The RTS Feed and InSite agent is populated automatically. WITSML Feed or Insite is used to acquire data from the rig.
Following Fields are displayed in the settings screen:
| Field | Description |
|---|---|
| Server Name | Describes the name of the server. |
| Source Type | Displays Insite and RTS Witsml Feed as inputs. |
| URL | Server URL will be displayed |